Join Our Telegram channel to stay up to date on breaking news coverage
Litecoin Price Prediction – October 24
According to the daily chart, the Litecoin price prediction may be looking for support at $180 where the market is likely to rebound.
LTC/USD Market
Key Levels:
Resistance levels: $215, $225, $235
Support levels: $170, $160, $150
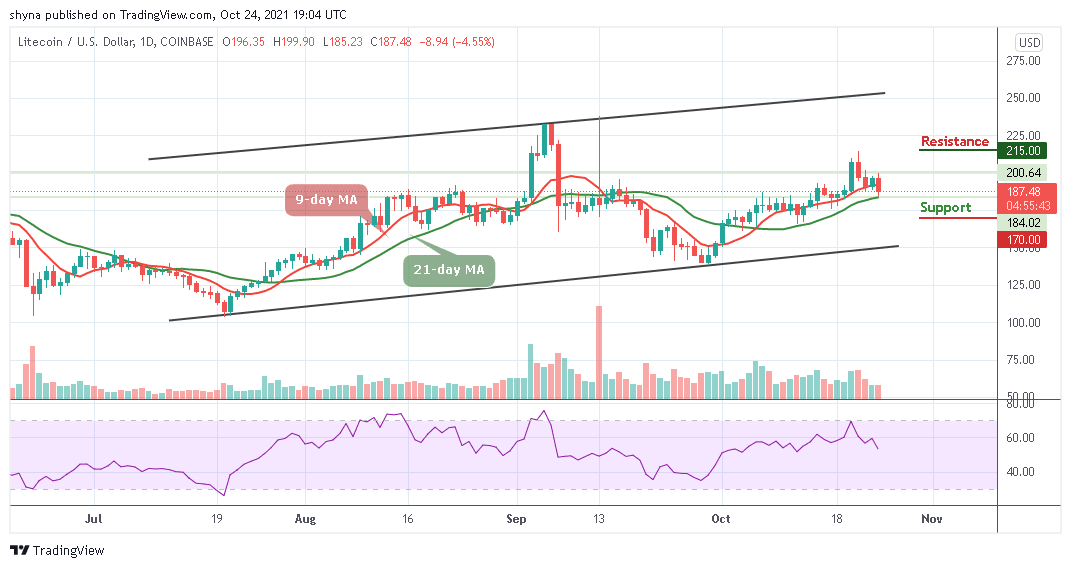
For the past few days, LTC/USD has been following the bearish movement as the market price slides below the 9-day and 21-day moving averages but if the Litecoin price improves in the last hours of the day, the intraday traders may expect a positive close above the opening price of $196 level. At the time moment, the sellers keep focusing on the downside, suggesting more bearish movements for the coin.
Litecoin Price Prediction: Litecoin Price May Fall More
As reveals by the daily chart, the Litecoin price may continue to experience a downtrend if it continues to trade below the 9-day moving average and probably cross below the 21-day moving average. However, if the coin falls beneath the support at $180, traders may expect another fall towards the support levels of $170, $160, and $150 respectively.
On the upside, if the bulls step back into the market, the Litecoin price towards the upper boundary of the channel as higher resistance levels could be located at $215, $225, and $235. Nevertheless, the technical indicator Relative Strength Index (14) nosedives below 55-level which reveals that sellers may continue to control the market movement.
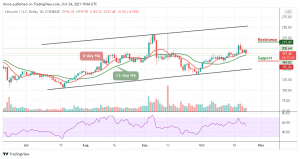
Against Bitcoin, the daily chart reveals that LTC remains at the downside as the coin retreats from the daily high of 3263 SAT. However, the sellers are seen posing more threat to the nearest support level of 3100 SAT. Meanwhile, an eventual break below the 9-day moving average may lead the coin to gain more downtrends.

However, as the technical indicator Relative Strength Index (14) reveals, the signal line is likely to cross below 40-level. Therefore, any further bearish movement could bring the coin to hit the critical support at 2900 SAT and below. But if the buyers return the price back above the 21-day moving average, LTC/BTC may likely reach the potential resistance at 3400 SAT and above.
Looking to buy or trade Litecoin (LTC) now? Invest at eToro!
68% of retail investor accounts lose money when trading CFDs with this provider
Join Our Telegram channel to stay up to date on breaking news coverage