
The Relative Price Of Oil – Levels Vs. Growth Rates
I hear a lot about “records”. Not so remarkable in levels, but very remarkable in growth rates.
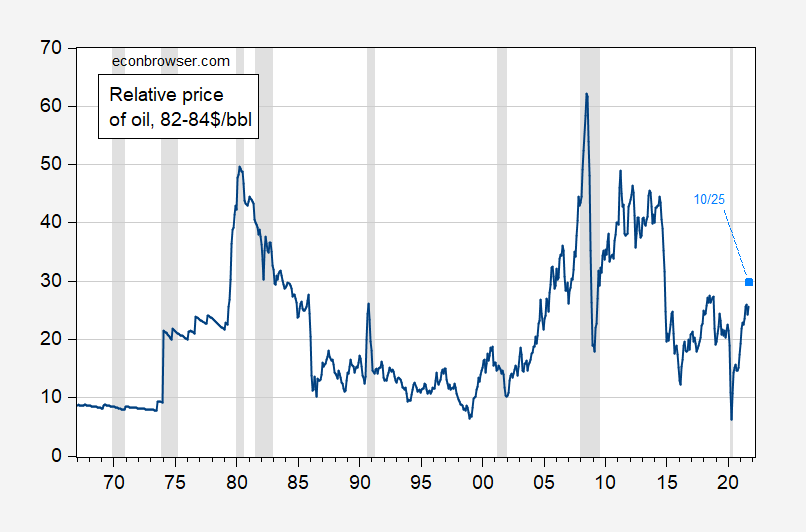
Figure 1: Price of WTI oil, deflated by Core CPI (blue), price of oil (10/25) deflated by nowcast Core CPI (sky blue square). NBER defined recession dates shaded gray. Source: FRED, Cleveland Fed, NBER and author’s calculations.
The September 24 1982-84$/bbl price of 26 is a little over the 1967-2021 mean of 21; the October 25th guesstimated relative price is 30, still less than a standard deviation above mean.
On the other hand, in terms of shocks, one might be interested in the change in relative prices within a short period of time. Figure depicts the year-on-year growth rates (calculated in log-differences).
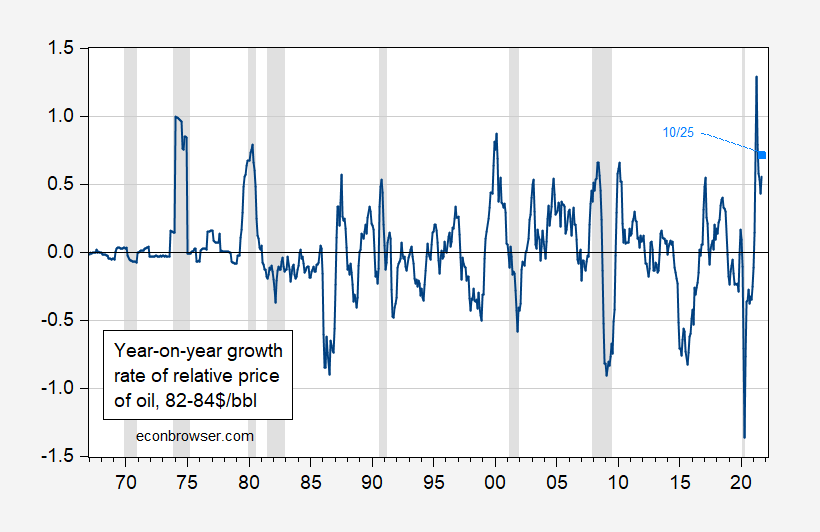
Figure 2: Growth rate (y/y) of price of WTI oil, deflated by Core CPI (blue), growth rate of price of oil (10/25) deflated by nowcast Core CPI (sky blue square). NBER defined recession dates shaded gray. Source: FRED, Cleveland Fed, NBER and author’s calculations.
The mean y/y growth rate is 0.016, while September’s value is 0.553. The standard deviation of changes in 0.323, so September’s change is about 1.7 standard deviations from mean. If October average price matches today’s price ($83.60 when last I checked on 10/25), then the y/y growth rate will be 0.710.
Disclosure: None.


