
Advertisement
Advertisement
October 29th 2021: DXY Plunges; EUR/USD Shakes Hands with Daily Resistance
By:
EUR/USD daily resistance at $1.1689, and trendline resistance, taken from the high $1.2254, together with $1.17 on the H1 scale, echoes a possible ceiling.

Charts: Trading View
EUR/USD:
(Italics: previous analysis)
Weekly timeframe:
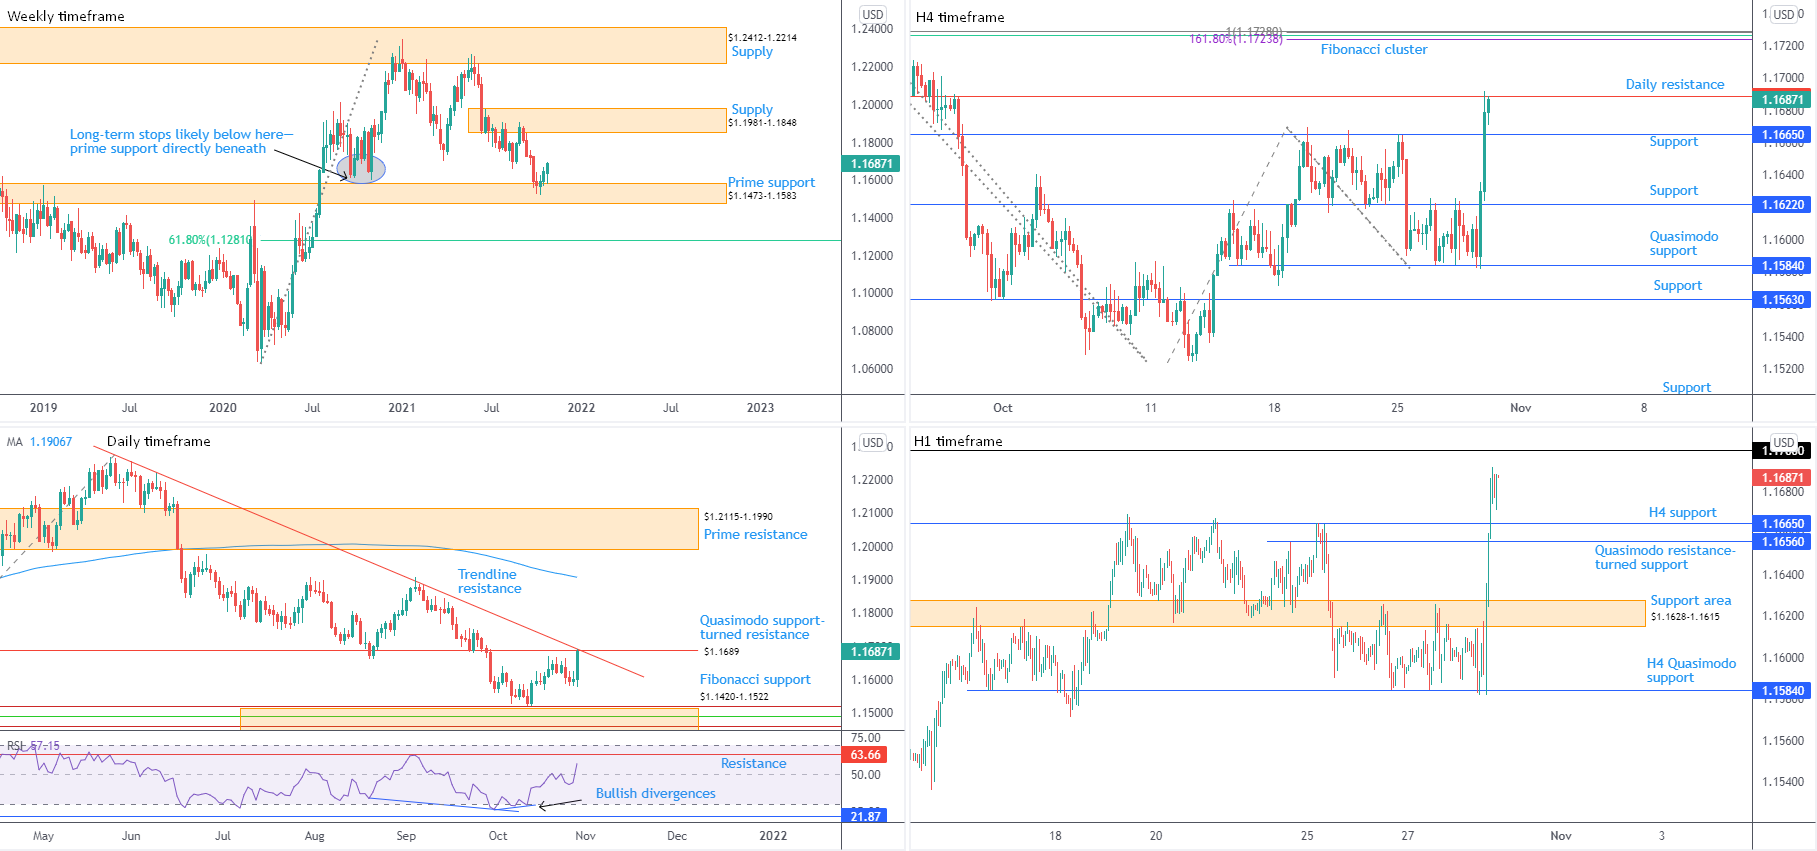
Buyers are finally beginning to display some leadership out of prime support at $1.1473-1.1583, consuming downside momentum derived from long-term sell-stops tripped beneath lows at $1.1612 (2020). $1.1981-1.1848 supply is recognised as the next upside objective.
In the event buyers fail to agree higher prices, south of current support shines the technical spotlight on a 61.8% Fibonacci retracement at $1.1281.
Daily timeframe:
Thursday witnessed the European Central Bank (ECB) maintain its current policy stance. In addition, the Q3 US advance GDP estimate reported a lower-than-expected print at 2.0 percent versus a 2.6 percent forecast, while US weekly unemployment claims came in at 281,000: the lowest level since mid-March 2020.
Europe’s shared currency booked healthy gains against its US counterpart, elevating EUR/USD to Quasimodo support-turned resistance at $1.1689, and trendline resistance, taken from the high $1.2254. Overriding said resistances helps validate the bullish response from weekly prime support at $1.1473-1.1583.
The relative strength index (RSI) muscled above the 50.00 centreline, informing traders that average gains exceed average losses and momentum is to the upside. Possible resistance resides at 63.66.
In terms of trend, sentiment has favoured downside since June. This, of course, may change should price make its way north of current trendline resistance.
H4 timeframe:
Although daily resistance is seizing the headlines at the moment, traders are urged to pencil in a Fibonacci cluster residing between $1.1729 and $1.1724, an area containing a 100% Fibonacci projection (AB=CD measurement) and a 61.8% Fibonacci retracement.
In the event daily resistance welcomes a bearish reaction, support is at $1.1665—a previous resistance that capped downside on three occasions last week.
H1 timeframe:
A closer reading of price action on the H1 timeframe has the unit within close range of testing $1.17, located a touch above daily resistance at $1.1689.
To the downside, eyes are likely on current H4 support from $1.1665, closely shadowed by H1 Quasimodo resistance-turned support at $1.1656.
Observed Technical Levels:
The combination of daily resistance at $1.1689, and trendline resistance, taken from the high $1.2254, together with $1.17 on the H1 scale, echoes a possible ceiling.
The flip side to this, of course, is weekly buyers powering through noted resistances and touching gloves with the H4 timeframe’s Fibonacci cluster between $1.1729 and $1.1724.
AUD/USD:
(Italics: previous analysis)
Weekly timeframe:
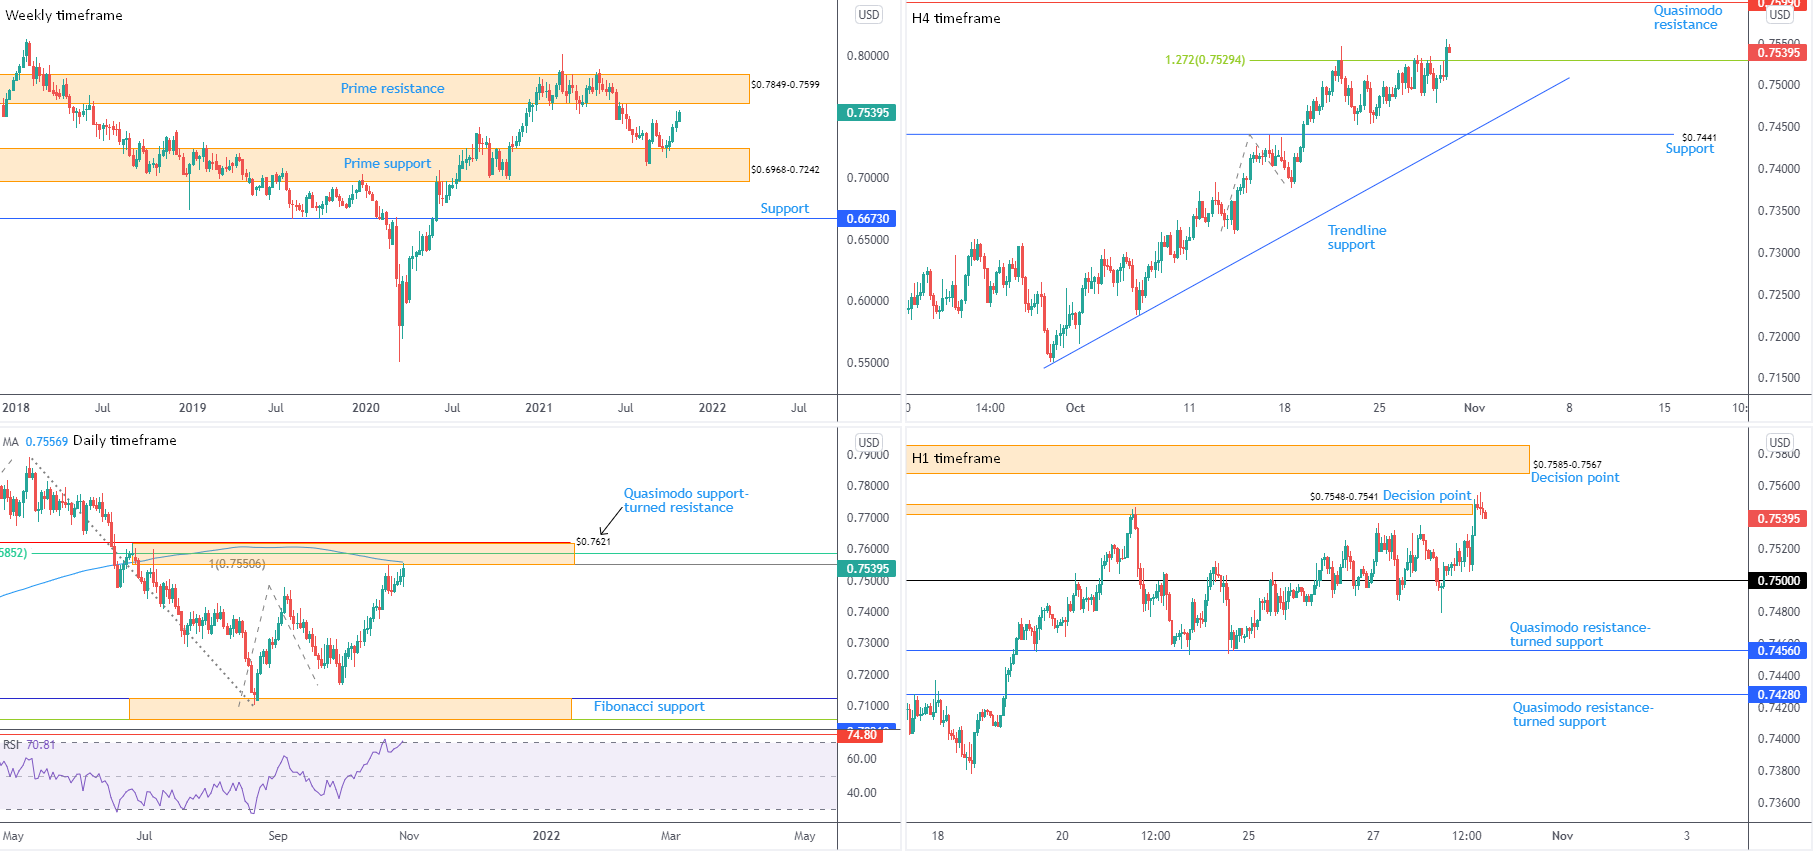
AUD/USD bulls remain bound for prime resistance at $0.7849-0.7599, on track to forge a fifth consecutive week in the green since departing from prime support from $0.6968-0.7242 at the end of September.
Trend studies on the weekly scale show we’ve been higher since early 2020. Consequently, the response from $0.6968-0.7242 might be the start of a dip-buying attempt to join the current uptrend, perhaps eventually overrunning $0.6968-0.7242 and challenging the yearly top at $0.8007.
Daily timeframe:
Resistance between $0.7621 and $0.7551—made up of a Quasimodo support-turned resistance at $0.7621, the 200-day simple moving average at $0.7557, as well as a 61.8% Fibonacci retracement at $0.7585 and a 100% Fibonacci projection at $0.7551—made an entrance on Thursday. Interestingly, noted resistance is fastened to the lower boundary of weekly prime resistance mentioned above at $0.7849-0.7599.
The relative strength index (RSI) welcomed overbought territory in recent days, highlighting indicator resistance at 74.80.
With respect to trend on the daily scale, last week probed fresh highs, helping to confirm the current upside bias.
H4 timeframe:
As anticipated, price action on the H4 timeframe channelled above the 1.272% Fibonacci projection at $0.7529, shining light on Quasimodo resistance from $0.7599.
The move higher left behind support at $0.7441 is seen, and trendline support, taken from the low $0.7170.
H1 timeframe:
Strong USD downside, along with upbeat risk sentiment, underpinned the risk-sensitive Australian dollar on Thursday, leading to a $0.7548-0.7541 decision point breach. Picturing the possibility of a retracement, $0.75 works as probable support.
A nearby decision point is seen at $0.7585-0.7567, which happens to sit within the walls of daily resistance mentioned above at $0.7621-0.7551.
Observed Technical Levels:
Scope to discover higher terrain remains on the weekly scale until reaching prime resistance at $0.7849-0.7599. However, glued to the lower side of this zone, we have daily resistance at $0.7621-0.7551 recently entering the fight.
Bolstering higher levels is H4 action showing room to approach Quasimodo resistance at $0.7599, and H1 eyeballing the decision point from $0.7585-0.7567.
USD/JPY:
(Italics: previous analysis)
Weekly timeframe:
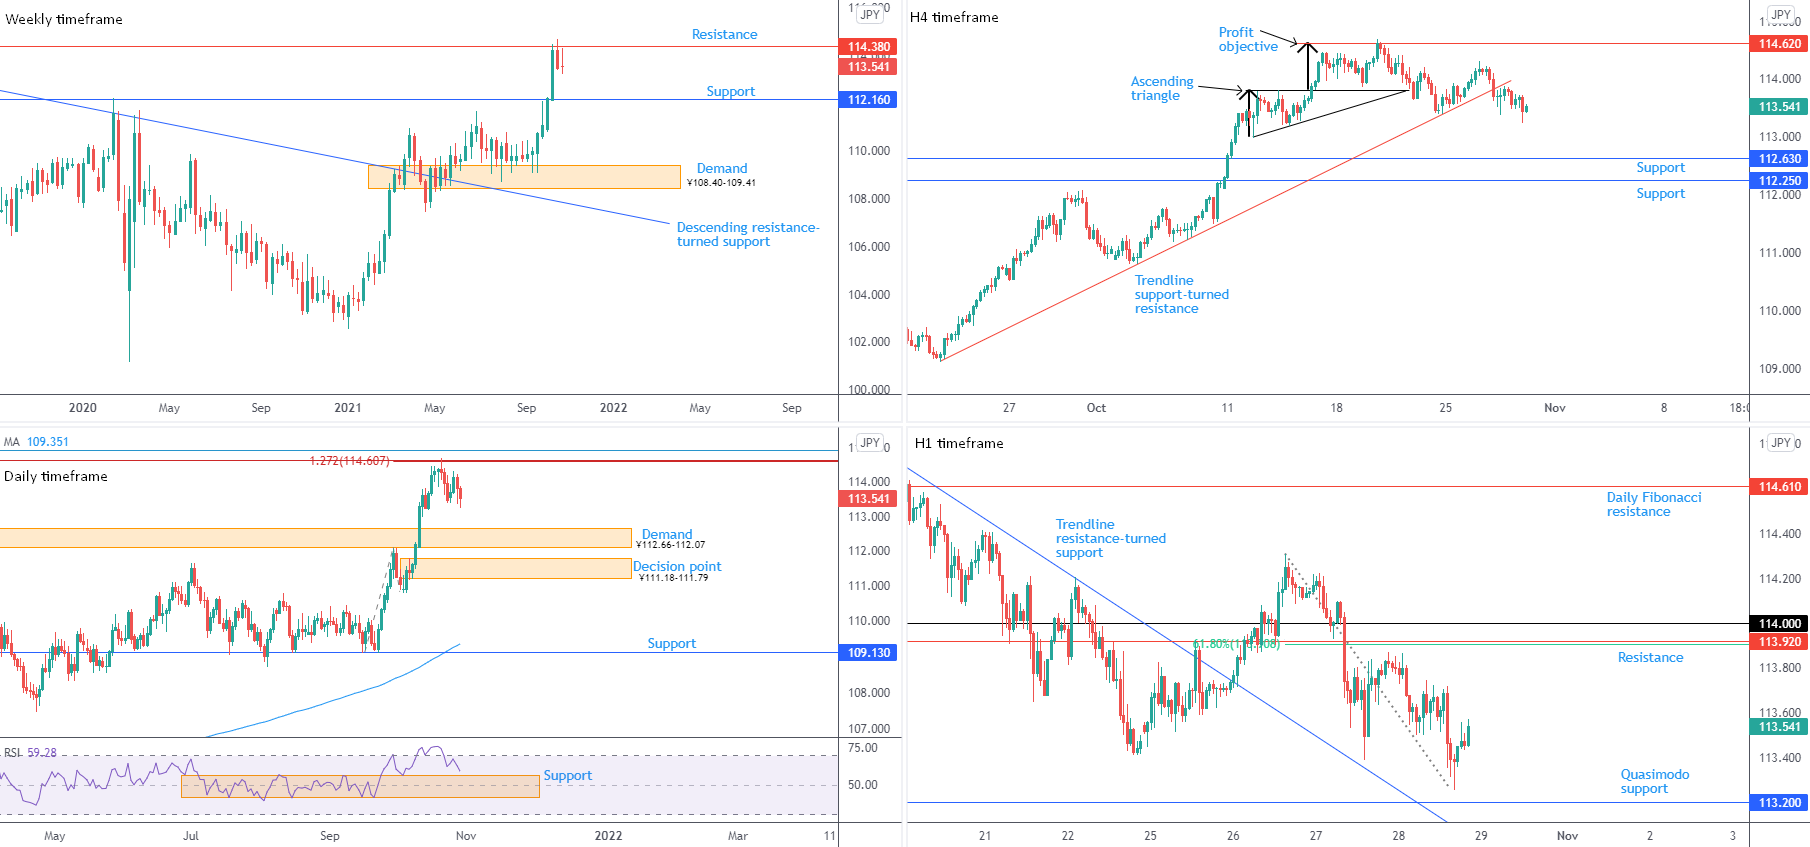
Nestled at the underside of resistance from ¥114.38, USD/JPY snapped a five-week bullish phase last week and touched a fresh three-year peak of ¥114.70. Continued bearish interest from resistance sets the stage for bringing in support at ¥112.16.
In terms of trend, we’ve been advancing since the beginning of this year.
Daily timeframe:
The Fibonacci cluster, made up of two 1.272% Fibonacci projections at ¥114.63 and ¥114.61, set a handful of pips beneath a deep 78.6% Fibonacci retracement at ¥114.94, continues to command attention on the daily timeframe. Price touched a low of ¥113.26 amidst Thursday’s movement, with subsequent follow-through action pointing to supply-turned demand at ¥112.66-112.07.
The noted resistance area, along with weekly resistance highlighted above at ¥114.38, is clearly a headwind for the currency pair right now.
From the relative strength index (RSI), the indicator’s value exited overbought space and appears poised to retest 56.85 support—prior range resistance.
H4 timeframe:
Meanwhile, price action on the H4 chart shows trendline support, taken from the low ¥109.12, was engulfed, revealing two support levels at ¥112.25 and ¥112.63. This followed last week’s test of an ascending triangle’s (low: ¥113 high: ¥113.79) profit objective (thick black arrows) at ¥114.62.
Technicians will note the aforementioned profit objective lined up closely with weekly and daily resistances.
H1 timeframe:
The US dollar preserved a weak tone against the Japanese yen on Thursday, pulling to a two-week low. Weighed by broad USD weakness, price came within touching distance of shaking hands with Quasimodo support at ¥113.20 during early US hours, before recoiling higher and mildly paring earlier losses.
Beneath ¥113.20, the ¥113 figure is seen as potential support while further recovery gains has resistance to target at ¥113.92 and a 61.8% Fibonacci retracement at ¥113.91.
Observed Technical Levels:
Ultimately, weekly, daily and H4 timeframes indicate bears are set to take the wheel until reaching H4 support at ¥112.63 (set within the upper border of daily supply-turned demand at ¥112.66-112.07). With that being the case, a pullback to H1 resistance plotted at ¥113.92 (reinforced by ¥114) could be a zone that triggers a bearish setup.
GBP/USD:
(Italics: previous analysis)
Weekly timeframe:
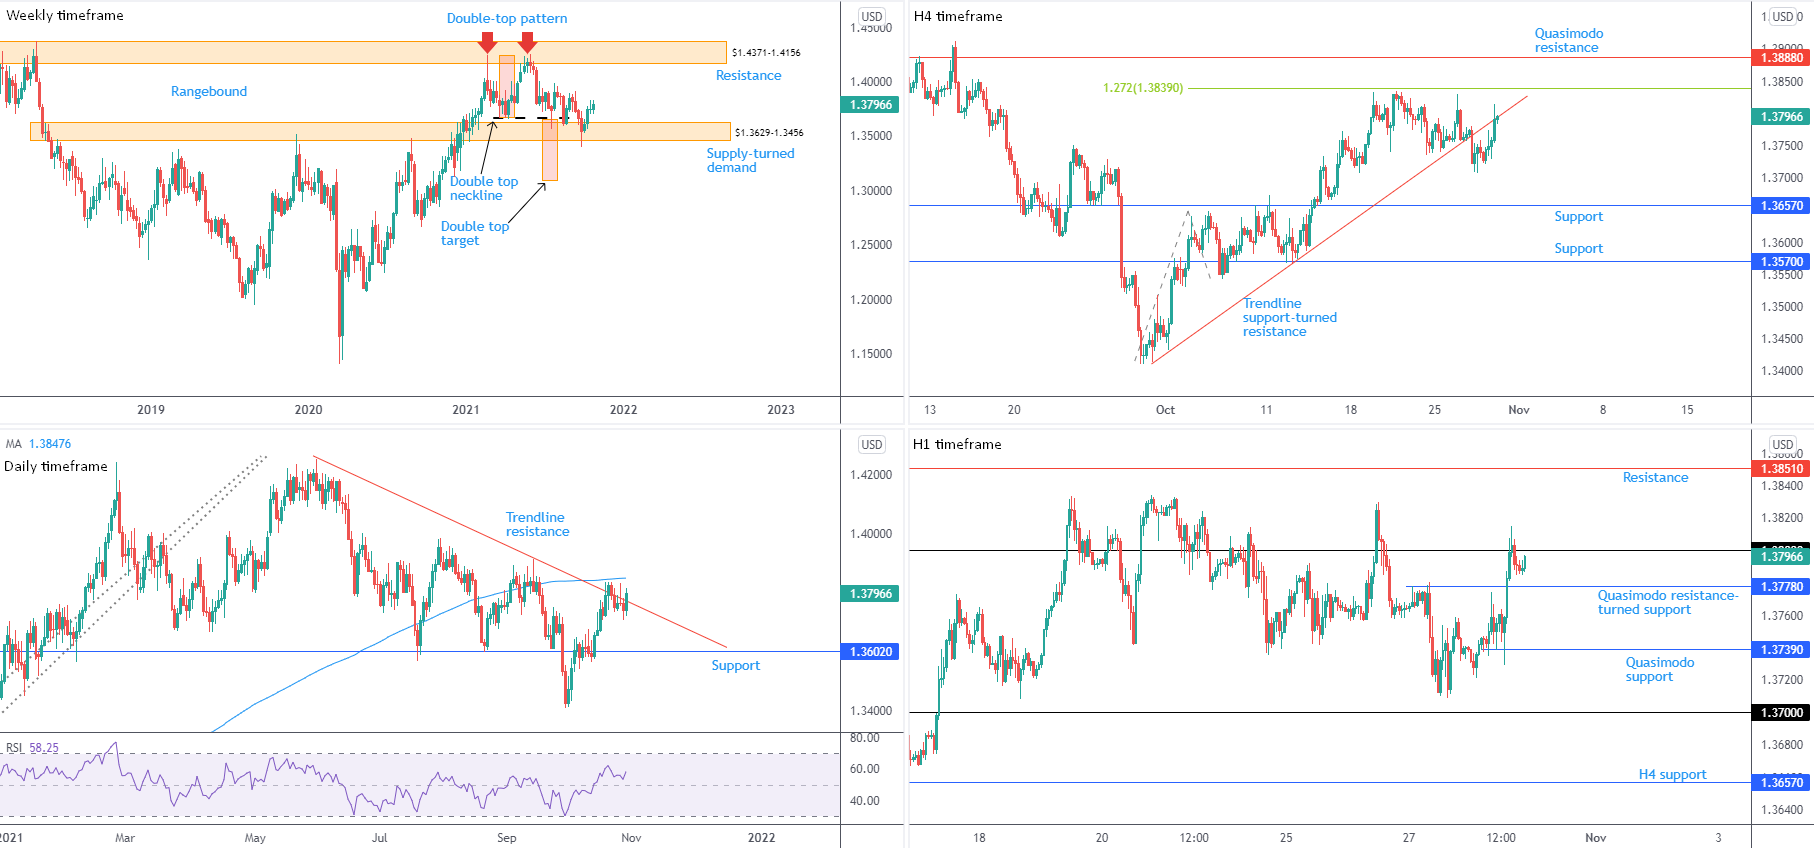
Despite dipping a toe south of supply-turned demand at $1.3629-1.3456 in late September, and closing under a double-top pattern’s ($1.4241) neckline at $1.3669, GBP/USD bulls have been healthy in October, up 2.4 percent MTD.
Should sellers regain consciousness, the double-top pattern’s profit objective—measured by taking the distance between the highest peak to the neckline and extending this value lower from the breakout point—sits around $1.3093.
Trend on the weekly timeframe has displayed a clear upside bias since pandemic lows in early 2020.
Daily timeframe:
Sellers are struggling to find acceptance at trendline resistance, taken from the high $1.4250; a breach underlines neighbouring (dynamic) resistance in the form of a 200-day simple moving average at $1.3848. Establishing a bearish presence from the aforesaid resistances, nevertheless, has support from $1.3602 to target.
The relative strength index (RSI) continues to explore terrain above the 50.00 centreline after chalking up a low around 53.36. Reaching for higher ground shifts interest to overbought territory.
With reference to current trend, despite the weekly timeframe eyeing higher levels, sentiment is directed lower for now, shaped in the form of lower highs and lower lows from June 1st top at $1.4250.
H4 timeframe:
Discovering a $1.3709 floor Thursday, trendline support-turned resistance, drawn from the low $1.3415, has put in an appearance.
Rejecting trendline resistance sets the stage for bringing in support at $1.3657; continuation moves higher, on the other hand, places the 1.272% Fibonacci extension at $1.3839 in sight.
H1 timeframe:
Recent candles made contact with $1.38 and, despite whipsawing to a high of $1.3815, the psychological barrier held ground. Quasimodo resistance-turned support at $1.3778 is within range, with subsequent bearish movement directing attention to an additional Quasimodo support from $1.3739 and maybe $1.37.
Tops around $1.3833 are visible north of $1.38, followed by resistance taken from $1.3851.
Observed Technical Levels:
Daily trendline resistance is hanging by a thread, suggesting the unit is likely to connect with the 200-day simple moving average around $1.3848, a dynamic value positioned nearby the H4 timeframe’s 1.272% Fibonacci extension at $1.3839 and H1 resistance from $1.3851. Thus, keep tabs on the aforementioned resistances should we form a daily close above daily trendline resistance.
Alternatively, H1 sellers coming in strong from $1.38 and tunnelling through Quasimodo support at $1.3778 signals short-term bearish control and possible moves to H1 Quasimodo support at $13739.
DISCLAIMER:
The information contained in this material is intended for general advice only. It does not take into account your investment objectives, financial situation or particular needs. FP Markets has made every effort to ensure the accuracy of the information as at the date of publication. FP Markets does not give any warranty or representation as to the material. Examples included in this material are for illustrative purposes only. To the extent permitted by law, FP Markets and its employees shall not be liable for any loss or damage arising in any way (including by way of negligence) from or in connection with any information provided in or omitted from this material. Features of the FP Markets products including applicable fees and charges are outlined in the Product Disclosure Statements available from FP Markets website, www.fpmarkets.com and should be considered before deciding to deal in those products. Derivatives can be risky; losses can exceed your initial payment. FP Markets recommends that you seek independent advice. First Prudential Markets Pty Ltd trading as FP Markets ABN 16 112 600 281, Australian Financial Services License Number 286354.
About the Author
Aaron Hillcontributor
Aaron graduated from the Open University and pursued a career in teaching, though soon discovered a passion for trading, personal finance and writing.
Did you find this article useful?
Latest news and analysis


Advertisement