
Advertisement
Advertisement
November 9th 2021: Sterling Eyeing Resistance at $1.3602; DXY Testing 94.00
By:
Daily resistance at $1.3602 on GBP/USD, combined with $1.36 on the H1 and H4 resistance at $1.3570, is an area that may welcome sellers, targeting $1.35ish.
Charts: Trading View
EUR/USD:
(Italics: previous analysis)
Weekly timeframe:
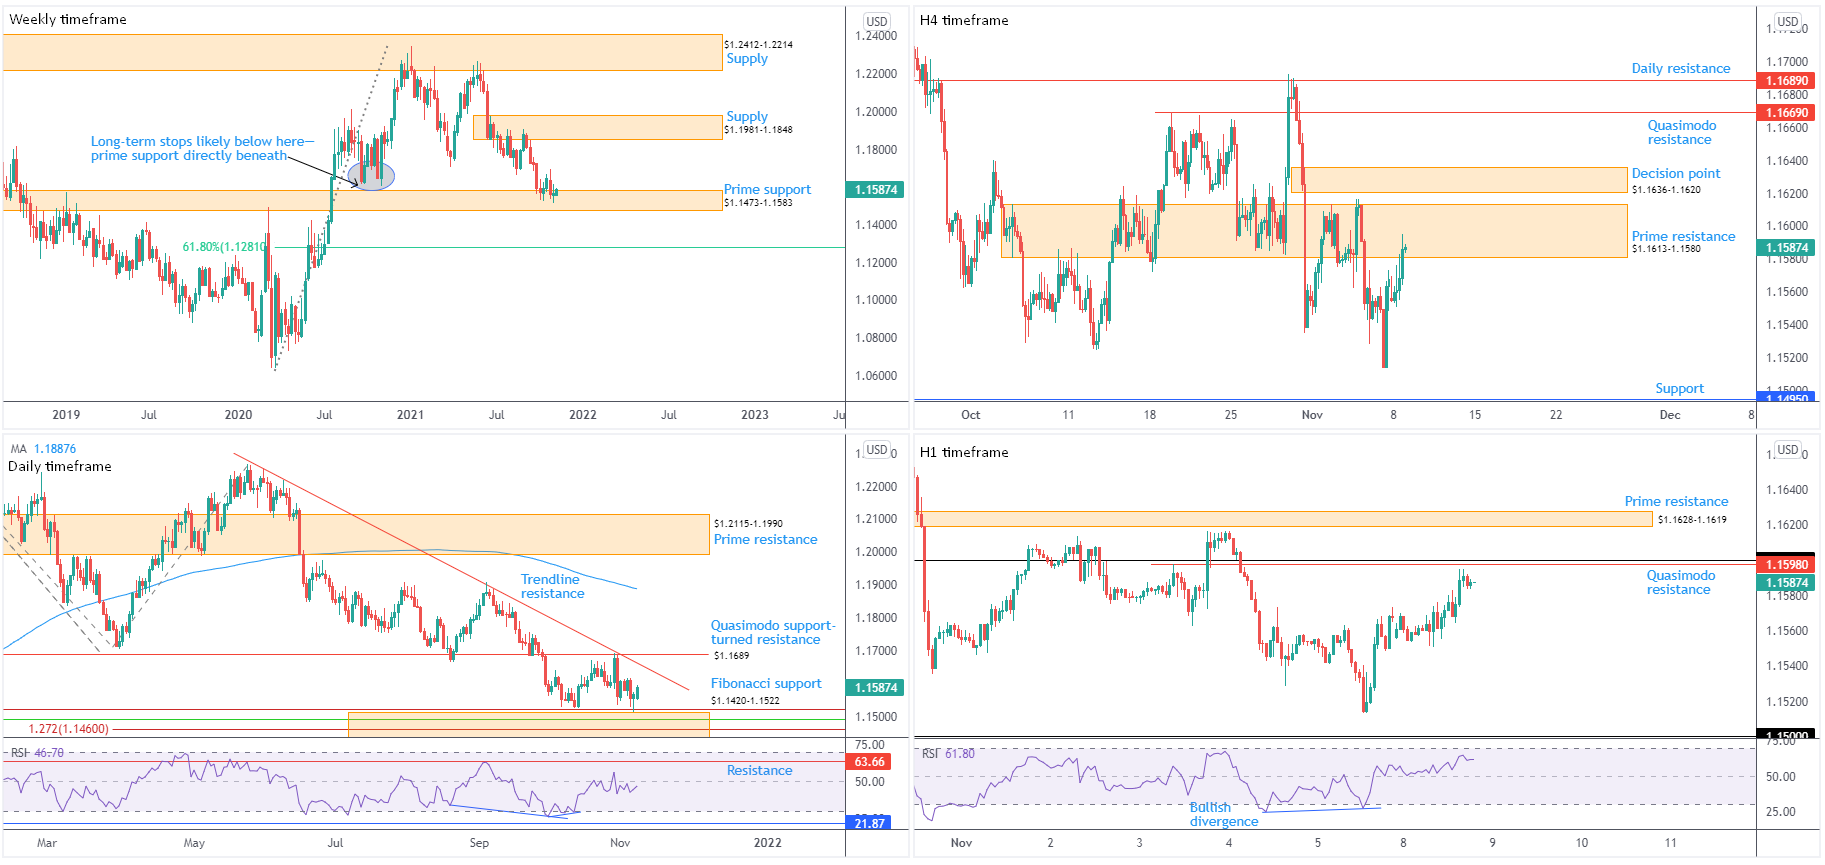
Prime support at $1.1473-1.1583 echoes vulnerability, emphasised through failure to find acceptance above $1.1692 highs. $1.1981-1.1848 supply is recognised as the next upside objective should buyers regain dominance, yet further underperformance shines the technical spotlight on a 61.8% Fibonacci retracement at $1.1281.
With reference to trend on the weekly chart, price taking out 2nd November low (2020) at $1.1603 suggests the currency pair is transitioning to a downtrend.
Daily timeframe:
Fibonacci support between $1.1420 and $1.1522—an area fastened to the lower side of weekly support—made its way into view on Friday and concluded the session considerably off session lows (hammer pattern). Europe’s single currency eked out modest upside Monday, extending recovery gains against its US counterpart to a high of $1.1595 into European trading.
Upstream features trendline resistance, taken from the high $1.2254, closely shadowed by Quasimodo support-turned resistance at $1.1689. Favouring the aforementioned resistances is sentiment favouring downside since late May tops at $1.2266. Also confirming current resistance is the relative strength index (RSI) accepting the 50.00 centreline as indicator resistance since late October.
H4 timeframe:
The US dollar index—geometric weighted average of the USD’s value against six international currencies—submitted a bearish narrative Monday, consequently elevating EUR/USD into the walls of prime resistance at $1.1613-1.1580. Technical observations reveal that north of the noted area has a decision point at $1.1636-1.1620.
Support at $1.1495, a clean support and resistance level boasting strong historical significance, was left unchallenged at the tail end of last week, establishing a V-shaped bottom at $1.1513.
H1 timeframe:
A closer examination of price action on the H1 chart has candle action on the doorstep of $1.16, a psychological barrier sharing chart space with Quasimodo resistance at $1.1598.
Prime resistance at $1.1628-1.1619 is a future zone should $1.16 step aside—traders may attempt to take advantage of buy-stops above $1.16. What’s interesting is $1.1628-1.1619 is secured to the lower side of the H4 decision point at $1.1636-1.1620.
Meanwhile, the relative strength index (RSI) is bound for overbought territory after creating a floor a touch above the 50.00 centreline. Simultaneously striking overbought and H1 resistances may appeal to some short-term players.
Observed Technical Levels:
Prime support on the weekly timeframe at $1.1473-1.1583, united with recently tested Fibonacci support on the daily timeframe between $1.1420 and $1.1522, saw recent price chalk up modest moves higher. While positive, trendline resistance, taken from the high $1.2254, closely shadowed by Quasimodo support-turned resistance at $1.1689, are potential roadblocks.
Lower on the curve, prime resistance on the H4 scale at $1.1613-1.1580 is active—housing the H1 timeframe’s $1.16 level. Though having seen higher timeframe price respond from technical structure, short positions could offer little. Therefore, sellers are urged to seek additional confirmation before considering pulling the trigger. Alternatively, a short-term bullish scenario might materialise above $1.16, targeting the H4 decision point at $1.1636-1.1620, followed by daily trendline resistance around $1.1650.
AUD/USD:
(Italics: previous analysis)
Weekly timeframe:
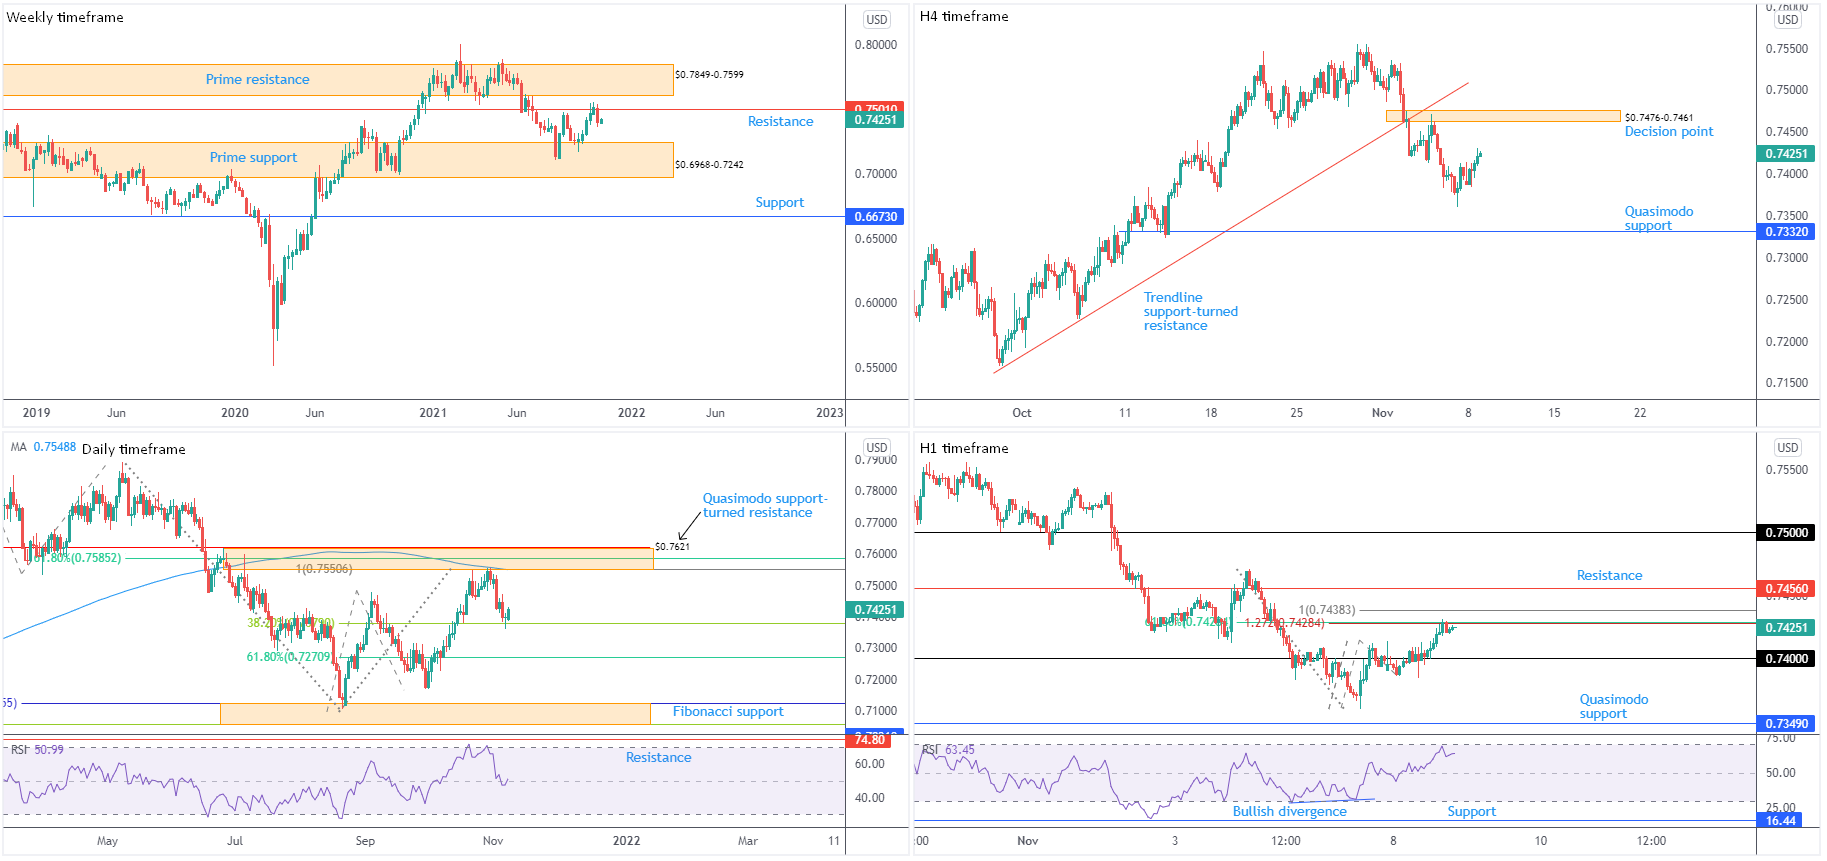
Resistance at $0.7501, slotted just under prime resistance from $0.7849-0.7599, remains active. Further losses could reignite prime support at $0.6968-0.7242, with subsequent interest below here shifting focus to support at $0.6673.
Despite current resistance, trend studies show we’ve been higher since early 2020.
Daily timeframe:
Dollar weakness and upbeat risk sentiment underpinned an AUD/USD bid Monday. Aided by Friday touching gloves with the 38.2% Fibonacci retracement at $0.7379, the currency pair added 0.3 percent on the session. Upriver has familiar resistance between $0.7621 and $0.7551, while a lack of follow-through buying shifts the 61.8% Fibonacci retracement from $0.7271 in sight.
The relative strength index (RSI) is circling the 50.00 centreline; defending this line helps validate a bullish appearance (average gains > average losses).
The trend on this timeframe is currently in line with weekly movement: favours upside following the break of 3rd September high at $0.7478.
H4 timeframe:
Meanwhile, out of the H4 chart, further upside could eventually bring light to a decision point at $0.7476-0.7461, while changing gears and moving lower has Quasimodo support at $0.7332 to target.
Trend on this timeframe is lower, forged by the recent breach of trendline support, taken from the low $0.7170.
H1 timeframe:
Discovering support off $0.74 in early London Monday provided sufficient (technical) impetus to explore higher territory. This, of course, is helped by the daily timeframe printing modest recovery gains from the 38.2% Fibonacci retracement at $0.7379.
Fibonacci structure has since offered mild resistance around $0.7428, shadowed by a 100% Fibonacci projection at $0.7438—an AB=CD bearish pattern. Clearance of the aforesaid Fibonacci ratios leads technical eyes to resistance coming in at $0.7456.
The relative strength index (RSI) came within a whisker of connecting with overbought territory.
Observed Technical Levels:
Weekly price retreating from resistance at $0.7501 communicates a bearish vibe, though do remain mindful that the daily timeframe welcomed a 38.2% Fibonacci retracement at $0.7379 as support. In addition, this support is in line with trend direction on both weekly and daily timeframes.
According to the above, the technical pendulum appears to be swinging in favour of additional buying—short-term dip-buying opportunities off $0.74 (H1), targeting H1 resistance at $0.7456?
USD/JPY:
(Italics: previous analysis)
Weekly timeframe:
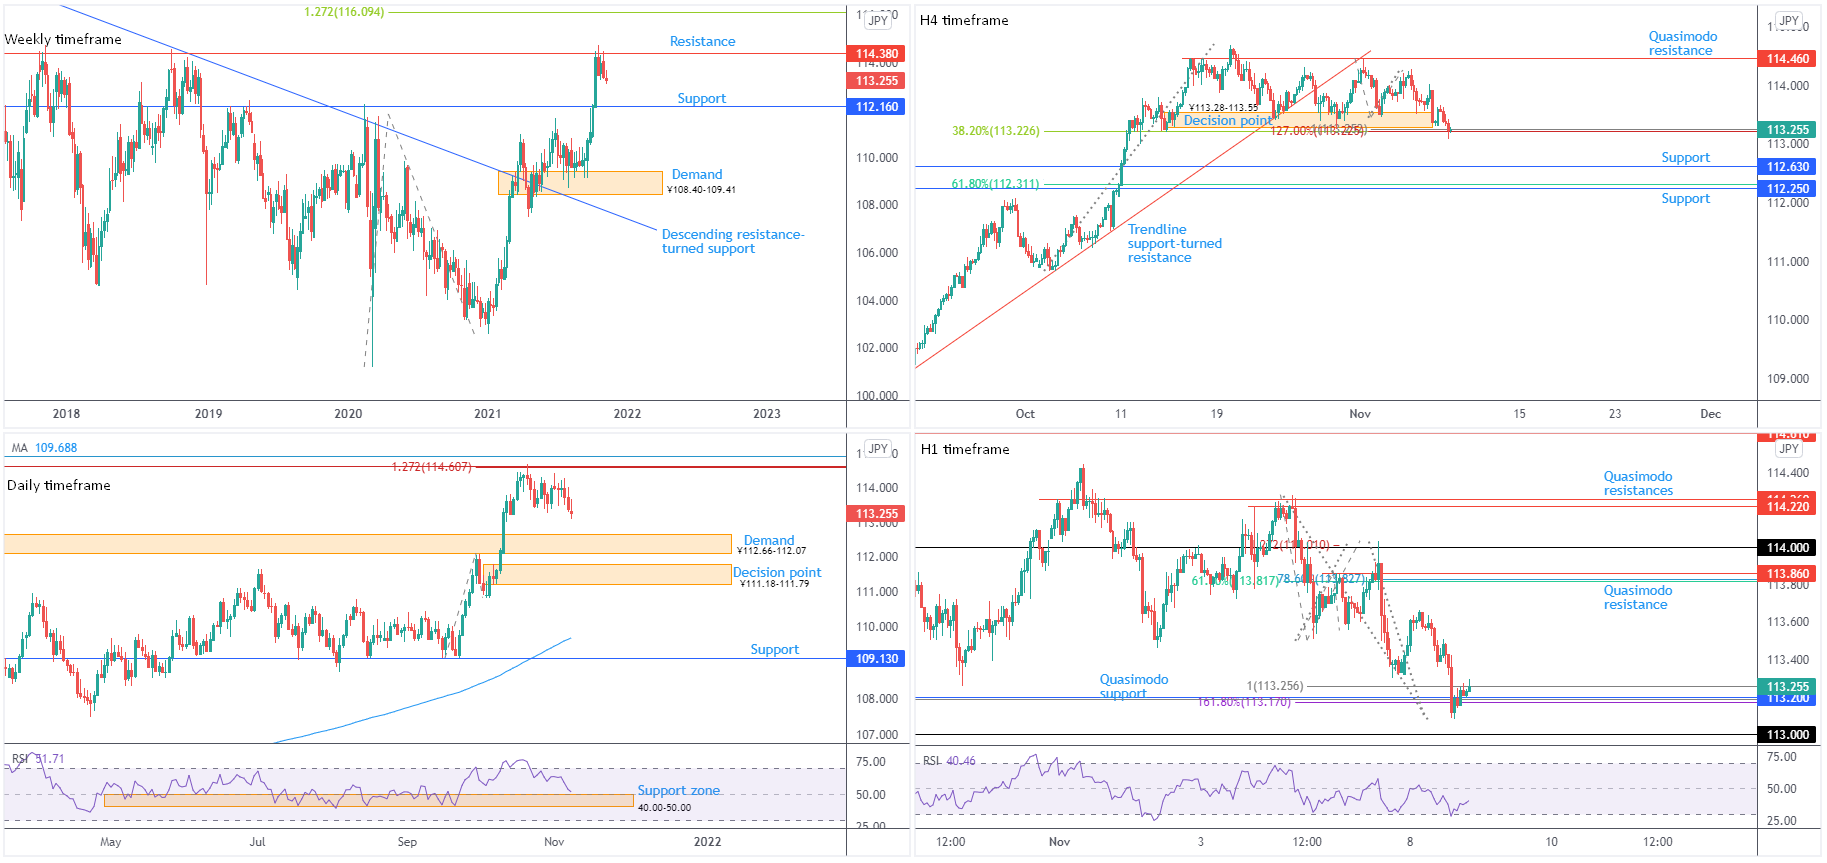
Mid-October had candle action embrace resistance from ¥114.38 and touch a fresh three-year peak of ¥114.70. Violating the noted resistance may excite long-term bulls and highlight a 1.272% Fibonacci projection from ¥116.09.
Capping upside attempts since May 2017, ¥114.38 is considered ‘significant’ resistance in this market; bearish interest, however, sets the stage for bringing in support at ¥112.16.
In terms of trend, we’ve been advancing since the beginning of this year.
Daily timeframe:
The Fibonacci cluster, made up of two 1.272% Fibonacci projections at ¥114.63 and ¥114.61, set a handful of pips beneath a deep 78.6% Fibonacci retracement at ¥114.94, continues to command attention on the daily timeframe. The noted resistance area, along with weekly resistance highlighted above at ¥114.38, clearly remains a headwind for the currency pair right now.
Supply-turned demand at ¥112.66-112.07 is set as the next downside target, shadowed by a decision point coming in from ¥111.18-111.79.
The relative strength index (RSI) exited overbought territory and is on the edge of support between 40.00 and 50.00. Note that amid prolonged uptrends, indicator support often forms around the 50.00 area and operates as a ‘temporary’ oversold base.
H4 timeframe:
The ¥113.28-113.55 decision point highlighted in Monday’s weekly market insight, as anticipated, was cast aside on Monday, allowing for a test of a neighbouring Fibonacci cluster around ¥113.23. In the event buyers reassert control from here, Quasimodo resistance is seen at ¥114.46.
Breaching noted Fibonacci levels will focus attention on bearish setups, pursuing support at ¥112.63, a previous Quasimodo resistance level that’s set within daily demand at ¥112.66-112.07.
While both weekly and daily timeframes show a trending market, the H4 scale recently penetrated trendline support, taken from ¥109.12.
H1 timeframe:
Joining H4 Fibonacci structure is the H1 timeframe’s Fibonacci area between ¥113.17 and ¥113.26, a zone confirmed by a relative strength index (RSI) oversold signal alongside additional support from H1 Quasimodo support at ¥113.20.
Continuation moves higher from current Fibonacci support could lift price to as far north as Quasimodo resistance from ¥113.86, arranged a handful of pips above a modest Fibonacci cluster at ¥113.83.
Observed Technical Levels:
Short term, technical eyes are on Fibonacci support derived from H4 and H1 timeframes between ¥113.17 and ¥113.26, with H1 resistance at ¥113.86 in view as a reasonable target.
Long term, nevertheless, downside is favoured until crossing swords with the daily timeframe’s supply-turned demand at ¥112.66-112.07.
GBP/USD:
(Italics: previous analysis)
Weekly timeframe:
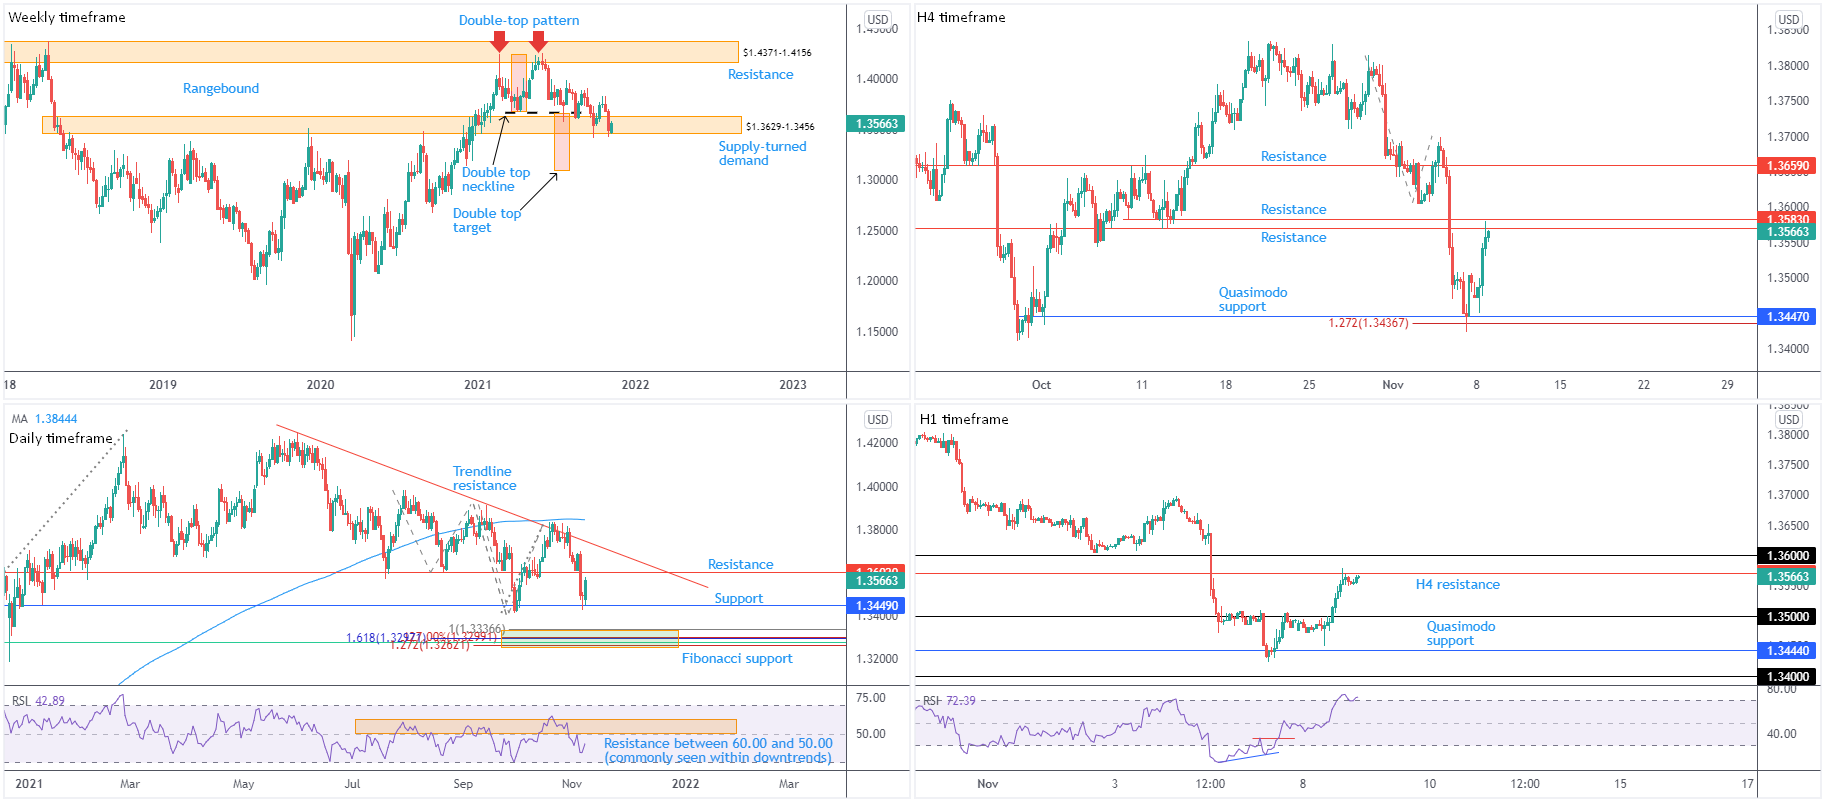
Despite buyers staging a modest recovery Monday, supply-turned demand at $1.3629-1.3456 remains under fire. Couple this with price closing under a double-top pattern’s ($1.4241) neckline at $1.3669 in August, sellers are still at the wheel, structurally speaking.
The double-top pattern’s profit objective—measured by taking the distance between the highest peak to the neckline and extending this value lower from the breakout point—delivers a reasonably objective downside target around $1.3093.
Trend on the weekly timeframe, nonetheless, has displayed an upside bias since pandemic lows in early 2020.
Daily timeframe:
A stronger-than-expected recovery emerged from support at $1.3449, with enough fuel to perhaps reach $1.3602 resistance. Territory above current resistance places trendline resistance nearby, extended from the high $1.4250, whereas below we can see Fibonacci support between $1.3262 and $1.3337.
The relative strength index (RSI) has been working with resistance between 60.00 and 50.00 since August, with the 30.00 oversold threshold providing equally impressive support.
With respect to trend on the daily scale, you will note the unit has been lower since June.
H4 timeframe:
Quasimodo support at $1.3447 proved a notable floor, strengthened by a 1.272% Fibonacci projection from $1.3437.
Monday left behind a 0.5 percent gain, pulling the currency pair to resistance between $1.3583 and $1.3570. A break of here unmasks an additional layer of resistance at $1.3659.
H1 timeframe:
Amidst a lack of USD demand, sterling gravitated through $1.35 to test H4 resistance noted above at $1.3570, a level sheltered under $1.36. In between the two noted levels, traders will acknowledge H4 resistance at $1.3583.
In terms of the relative strength index (RSI), we recently entered overbought space and pencilled in a peak of 74.76. Ultimately, traders will be watching for signs of divergence to form here, action increasing the odds of a reversal forming from between $1.36 and $1.3570.
Observed Technical Levels:
Daily resistance at $1.3602, combined with $1.36 on the H1 and H4 resistance at $1.3570, is an area that may welcome sellers, targeting $1.35ish.
DISCLAIMER:
The information contained in this material is intended for general advice only. It does not take into account your investment objectives, financial situation or particular needs. FP Markets has made every effort to ensure the accuracy of the information as at the date of publication. FP Markets does not give any warranty or representation as to the material. Examples included in this material are for illustrative purposes only. To the extent permitted by law, FP Markets and its employees shall not be liable for any loss or damage arising in any way (including by way of negligence) from or in connection with any information provided in or omitted from this material. Features of the FP Markets products including applicable fees and charges are outlined in the Product Disclosure Statements available from FP Markets website, www.fpmarkets.com and should be considered before deciding to deal in those products. Derivatives can be risky; losses can exceed your initial payment. FP Markets recommends that you seek independent advice. First Prudential Markets Pty Ltd trading as FP Markets ABN 16 112 600 281, Australian Financial Services License Number 286354.
About the Author
Aaron Hillcontributor
Aaron graduated from the Open University and pursued a career in teaching, though soon discovered a passion for trading, personal finance and writing.
Did you find this article useful?
Latest news and analysis


Advertisement