
Mexican Peso Weakens Amid Turkish Lira Meltdown & Rising U.S. Yields, USD/MXN Soars
The currency crisis continues to intensify in Turkey. At some point this morning, the Turkish Lira was crashing more than 15% against the U.S. dollar, briefly reaching ~13.55, its weakest level on record, as President Tayyip Erdogan doubled down on his support for loose monetary policy and vowed to win his economic war of independence.
The dramatic collapse of the Turkish lira can be blamed on several factors, but the main driver has been the unorthodox and reckless easing cycle undertaken by the country’s central bank (TCMB) despite rampant inflationary pressures. For context, TCMB has cut its policy rate by a total of 400 basis points to 15% since September, leaving real yields deep in negative territory, as annual inflation pushes towards 20% according to the latest CPI report.
The situation is Turkey has taken a toll on sentiment, dragging EMFX, though contagion is only part of the story. Rising yields in the United States has been the other source of weakness for emerging market currencies, particularly for the Mexican peso.
In the last few days, the U.S. Treasury curve has shifted higher as traders have started to bet that the Federal Reserve will tighten monetary polity at a faster pace than anticipated in 2022 to combat inflation and ensure CPI expectations remain anchored. In this context, the 2-year yield has surged from 0.51% to 0.61% since Monday last week, pushing USD/MXN from 20.51 to a high of 21.30.
Over the short-term, monetary policy repricing in the US and weak appetite for EM assets amid the current turmoil in Turkey’s currency market should weigh on the Mexican peso. This means USD/MXN may remain biased to the upside heading into the final month of the year, with the 21.50 level in sight.
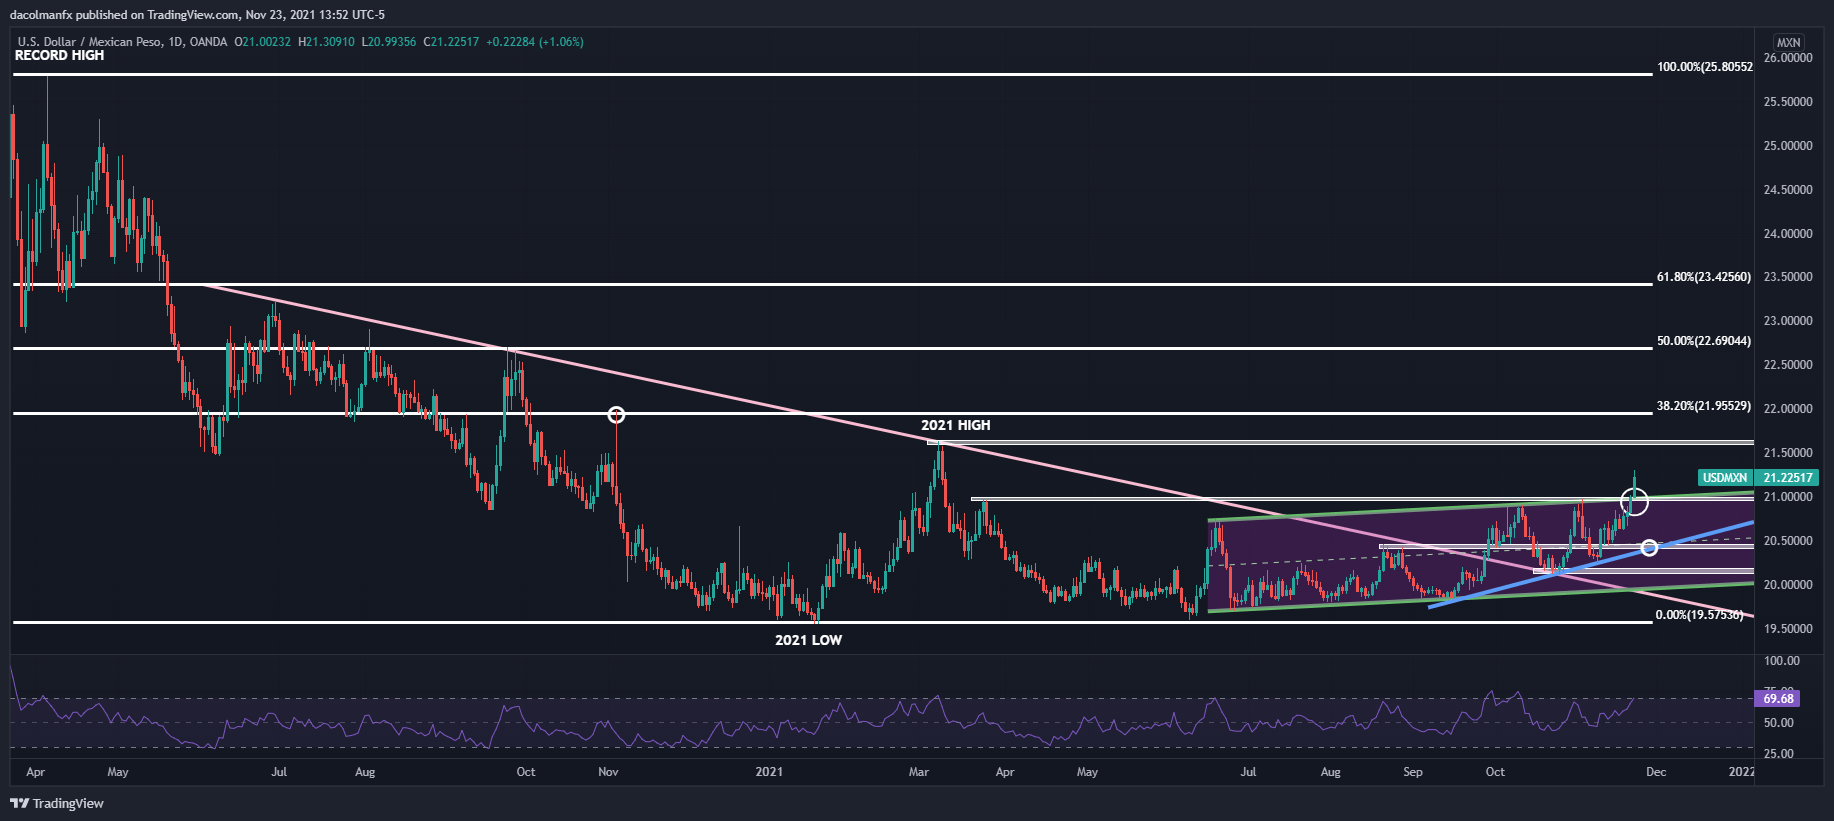
From a technical perspective, USD/MXN breached cluster resistance near 21.00 on Tuesday, a bullish event that accelerated the dollar’s rise. With buyers in clear control of the market and momentum on its side, price could climb towards the 2021 high in coming sessions before targeting 21.95, a level defined by the 38.2% Fibonacci retracement of the 2020/2021 decline.
On the other hand, if USD/MXN fails to sustain strength and pivots lower, support appears at the 21.00 psychological mark. If a pullback does materialize, traders should carefully watch this area, as a move below it may trigger a larger retreat towards 20.40.
USD/MXN TECHNICAL CHART
(Click on image to enlarge)
Disclaimer: See the full disclosure for DailyFX here.


