
Ethereum has fallen victim to a collapse in worldwide markets on Friday after Thanksgiving. The crypto markets have had a disappointing week, with most large-cap assets down steeply as investors retreated from risk markets around the world amid concerns over the impact of a potentially dangerous new COVID-19 variant. ETH plunged slightly lower than the closely observed $4,000 threshold to a $3,915 low. However, as the market rebounds, ETH/USD returns to challenge the $4,200 key resistance. At the time of analysis, Ether is hovering at $4,146, gaining 2.25% on the day after reaching an intraday high of $4,186. The token’s all-time high of $4,867 may act as a further roadblock for Ethereum’s price, although a break above this level could reveal more positive intentions for the cryptocurrency. Since the EIP-1559 occurred, also referred to as the London hard fork, $4.24 billion in ETH has been burned. As per data from Ultrasound, a total of 5.4 million ETH is issued per year, while it burns a total of 4.7 million with a reduced balance resulting in a supply growth of 0.6% per annum. It depicts evidence that Ethereum is continuing on its deflationary path.
Key Levels
Resistance Levels: $4,700, $4,400, $4,200
Support Levels: $4,000, $3,700, $3,500
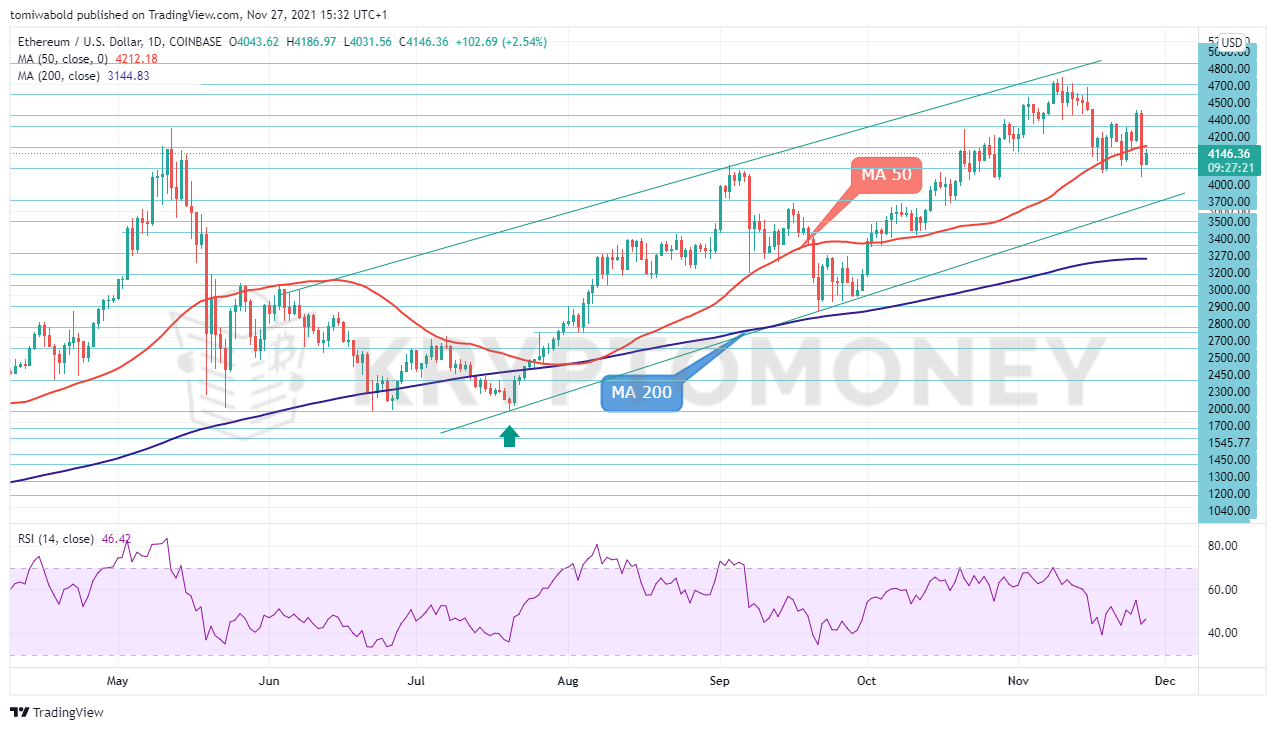 ETH/USD Daily Chart
The price drop below the moving average (MA 50) on the daily chart indicates downward pressure. Near-term selling activity also prevailed as the no. 2 crypto battled to stay above the support at $4,000, which was previously a barrier from last September’s peak and mid-October. Thanks to a spike in positive actions as negative momentum decreases.
Overall, Ether has recouped some losses after plunging to $3,915. Since the loss generated a 4-week low, buyers’ emergence around the $4,000 handle may attempt to make a bullish return. The decline from the $4,861 all-time high is reinforced by the bearish Relative Strength Index signaling a slowdown in the upward momentum.
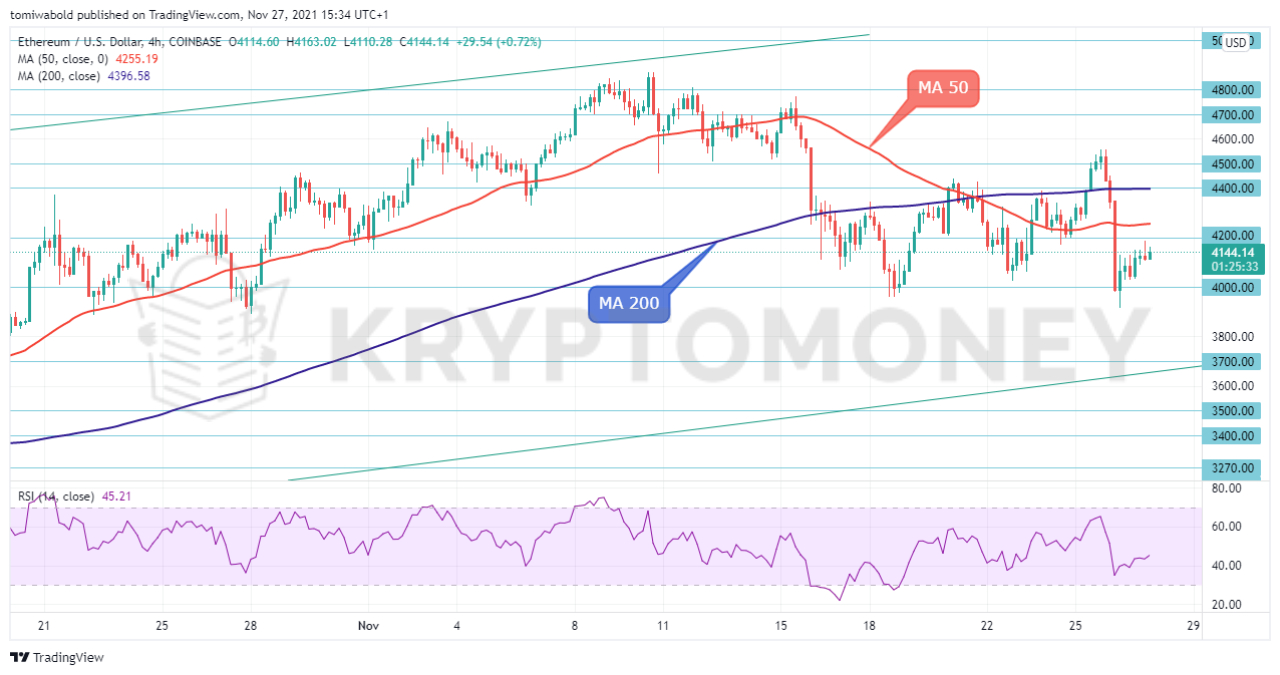 ETH/USD 4-Hour Chart
Currently, the short-term oscillators suggest bulls are promoting additional advances in the pair above the $4,000 mark. However, bears’ may sell on rallies beneath the 4-hour moving average (MA 50) around $4,200. If buyers manage to extend the rebound past this region, initial upside friction could commence at the moving average (MA 200) at $4,400.
Otherwise, if positive forces start to subside, preliminary support could stem from the $4,000 mark, the lower support region at $3,800. And should the bearish trajectory resume, the price could target the ascending trendline around $3,700. ETH/USD is exhibiting a range-like bias, and for bulls to counter bears, buyers need to steer the price above the $4,200 barrier.
Note: Kryptomoney.com is not a financial advisor. Do your research before investing your funds in any financial asset or presented product or event. We are not responsible for your investing results
Image Credit: Shutterstock


Keep in mind that we may receive commissions when you click our links and make purchases. However, this does not impact our reviews and comparisons. We try our best to keep things fair and balanced, in order to help you make the best choice for you.