
Ripple Price Prediction: Bearish While Below $1.3

Image Source: Pixabay
Ripple (XRP-X) trades with a bearish tone as it falls below parity again. On its way lower, it has broken the b-d trendline of a bearish contracting triangle. While below $1.3, the bias remains bearish.
Ripple is one of the most popular cryptocurrencies, with a market capitalization of $43 billion. Currently, there are around 47.16% of XRP’s circulating, or roughly 47% of all the coins that will ever exist in the lifetime of this currency.
Before looking at Ripple’s daily chart, it is essential to distinguish between three terms – XRP, Ripple, and RippleNet. XRP is a currency running on RippleNet – a digital payment platform, while Ripple is the company running RippleNet.
Therefore, when traders refer to buying or selling Ripple, they actually buy or sell XRP against some other crypto or fiat currency. In our case, we have a look at the XRP-USD exchange rate, the most popular among traders.
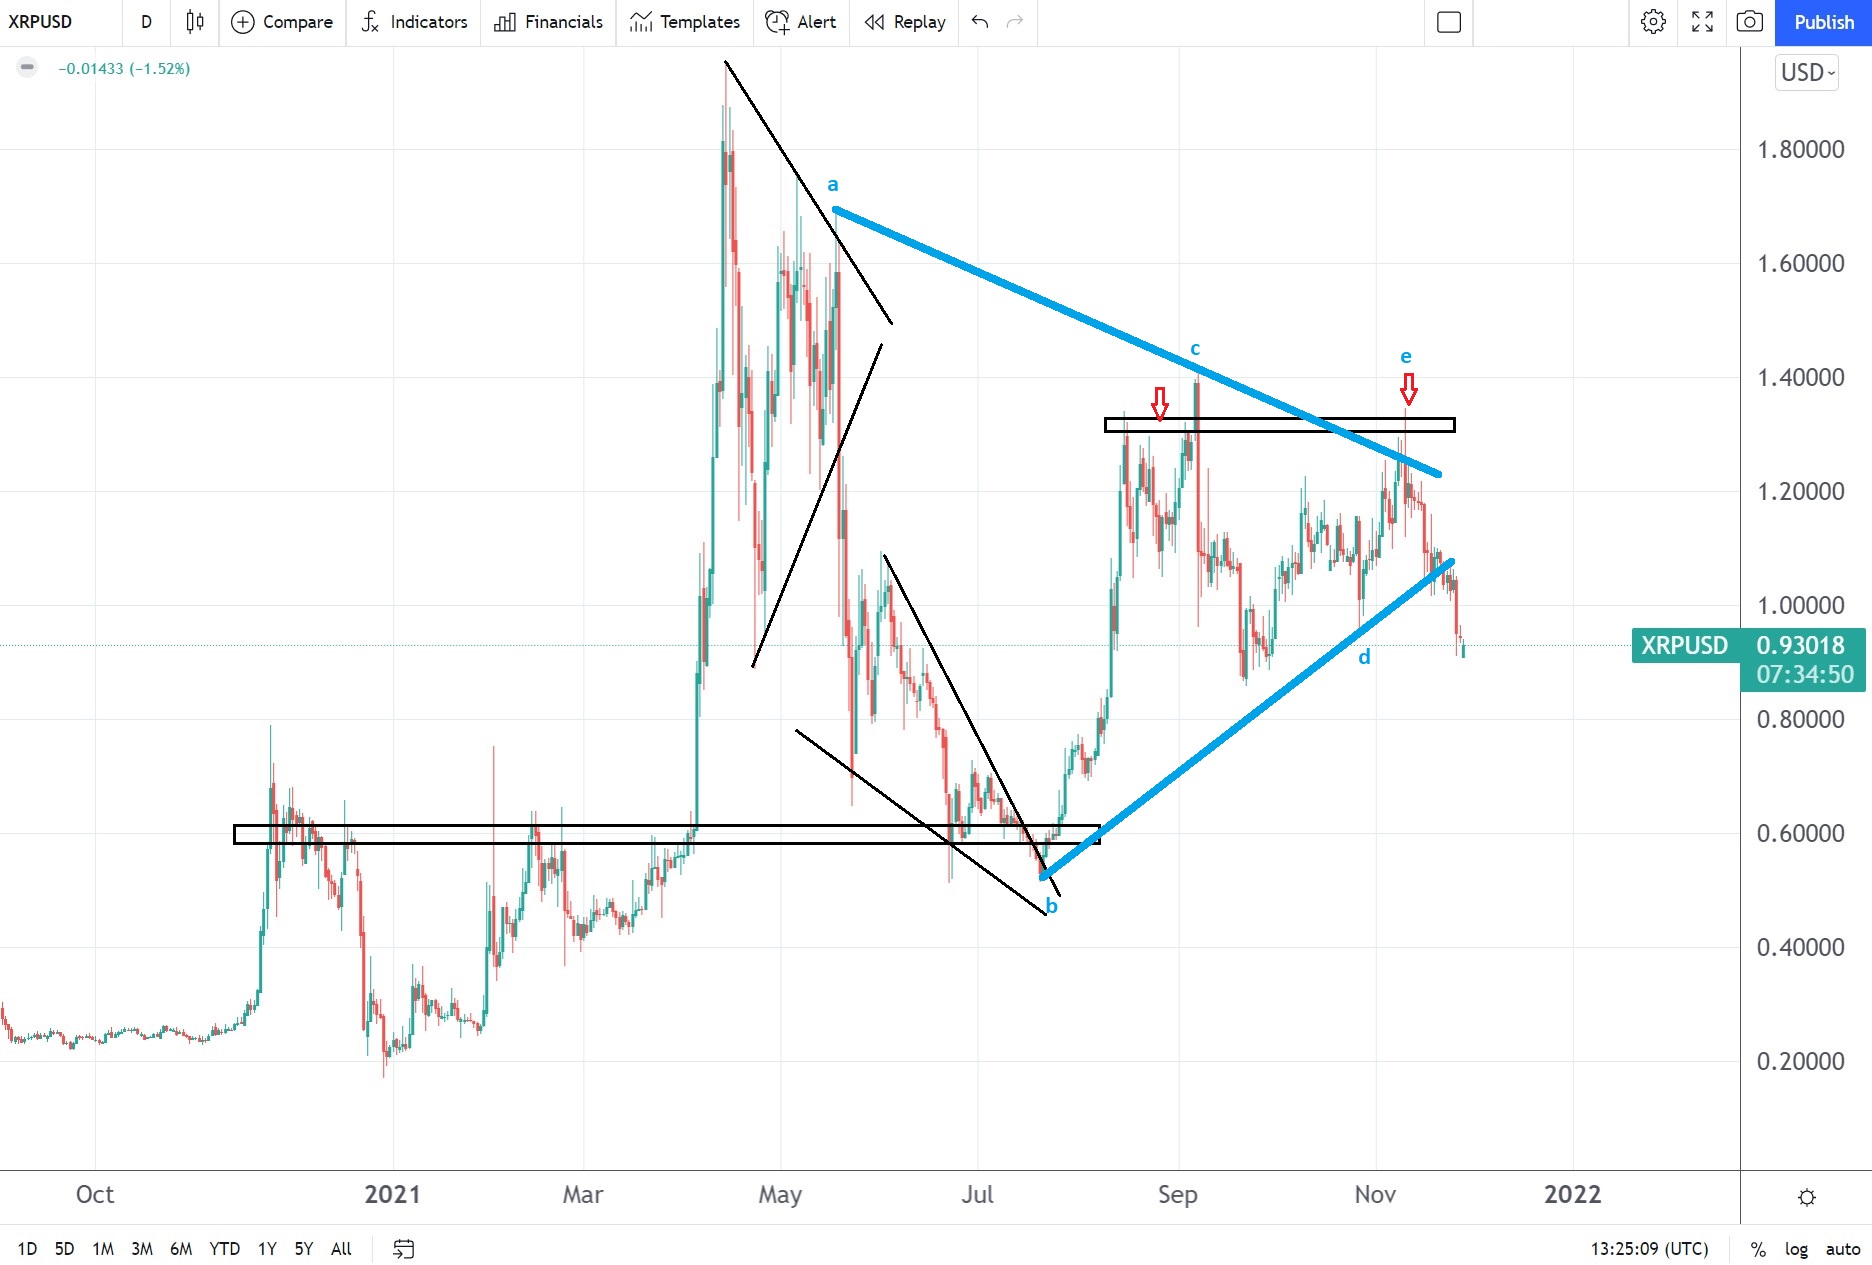
The technical perspective looks bearish while XRPUSD remains below $1.3. The chart above may look confusing, but it shows a bearish picture for the period ahead. It focuses on two perspectives – one historical and one forward-looking.
From a historical perspective, we see Ripple having a hard time passing $0.6 in late 2020 and early 2021. It formed an ascending triangle that broke higher in April this year and the price did not stop until it reached close to $2. However, up there, a contracting triangle acted as a reversal pattern, and the market collapsed back to the $0.6 area, where it found support.
In doing so, it consolidated for a while, forming a bullish pattern – a falling wedge. But after the falling wedge broke higher, Ripple was not able to break the $1.3 area. Instead, it formed a double top pattern and it now trades with a bearish tone.
The recent drop below $1 looks bearish from a forward-looking perspective, as illustrated by the blue contracting triangle. The market broke the b-d trendline and, unless it reverses back above $1.3, this is a bearish development.
Furthermore, the measured move of such a triangle is 75% of its longest segment and thus, it points to a drop below the $0.6 support level. Ripple has been recently trading at around $0.91.
Disclaimer: None of the content in this article should be viewed as investment advice or a recommendation to buy or sell. Past performance/statistics may not necessarily reflect future ...
more

