Join Our Telegram channel to stay up to date on breaking news coverage
Bitcoin Price Prediction – November 29
There have been notable smaller downs and ups in the BTC/USD business operations as the crypto market trades at the $55,000 zone. The crypto-economic market is currently at a negative percentage rate of about 5.38, trading around the $57,007 level. That shows that some degrees of lowering pressures are still in the play.
BTC/USD Market
Key Levels:
Resistance levels: $60,000, $62,500, $65,000
Support levels: $52,500, $50,000, $47,500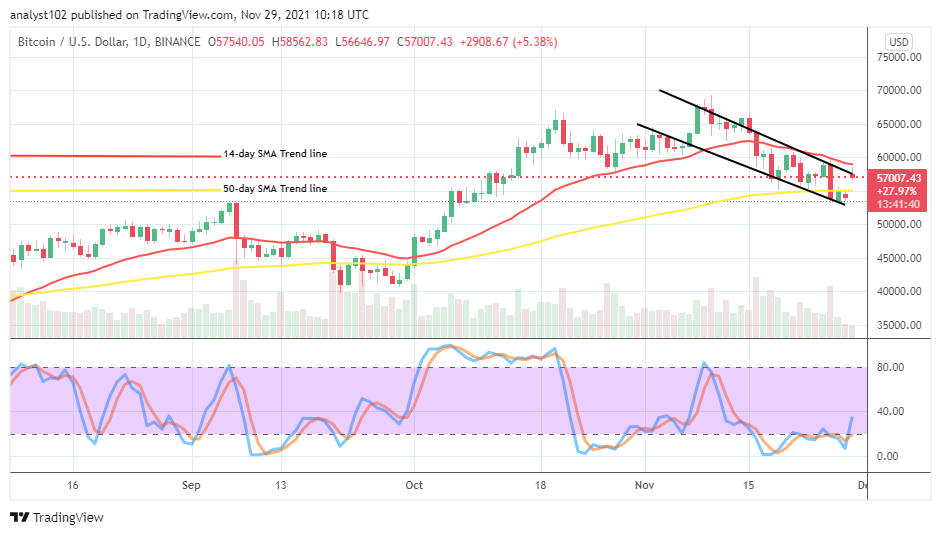
BTC/USD – Daily Chart
The BTC/USD daily chart reveals that the crypto market trades at the $55,000 zone as there has been an upward gap in today’s session. That indicates that the market has gained some profits as it tries to regain its momentum. The 14-day SMA indicator is above the 50-day SMA indicator. The Stochastic Oscillators have swerved the lines from the range of 20 toward a range of 40 to signify that an upward motion is somewhat ongoing.
Is there a possibility that the BTC/USD price will survive, breaking down further at $55,000 as the crypto-economic market trades around it?
It’s somewhat becoming dicey that the BTC/USD southward price movers will survive, breaking down further at $55,000 level afterward as the crypto market trades around it. Despite the current upward gap in this trade activity, some signs show that the price may still move down to the value-line for a retest. Buying pressures are seemingly gathering strength to upsurge northward from that value line.
On the downside of the technical analysis, the BTC/USD market bears would have to mount more pressures in the market under the trend line of the 14-day SMA. The market level at $60,000 will serve as the barrier against pushing the market northward. In the event of range-bound trading resuming, that value line and the lower level at $55,000 will likely be zones to embody the presumed ranging movements.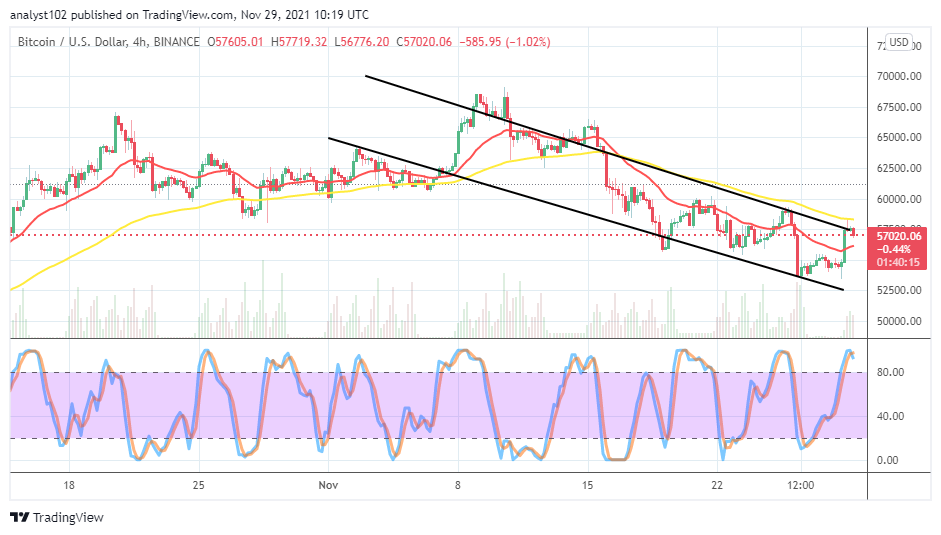
BTC/USD 4-hour Chart
The BTC/USD 4-hour chart showcases that the crypto market trades around $57,500, a near higher level to $55,000 on the long-term trading chart. The 50-day SMA trend line is above the 14-day SMA trend line. The bearish channel trend lines drew to guide alongside the southward path that the market keeps. The Stochastic Oscillators are in the overbought region, seemingly trying to close the lines within it. That signifies that the crypto economy tends to witness a pause for a while in its movements.
Looking to buy or trade Bitcoin (BTC) now? Invest at eToro!
68% of retail investor accounts lose money when trading CFDs with this provider.
Read more:
Join Our Telegram channel to stay up to date on breaking news coverage