Published
2 years ago on
December 02, 2021
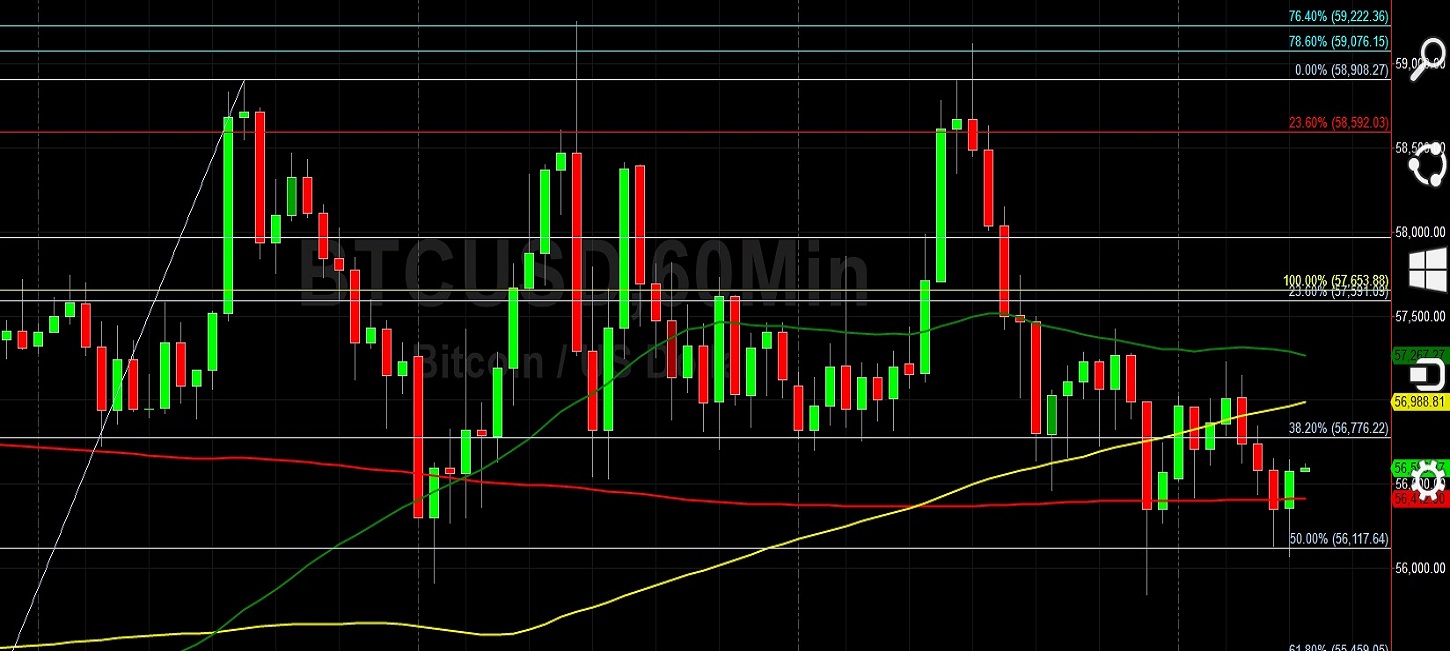
Bitcoin (BTC/USD) extended its pullback early in the Asian session as the pair depreciated to the 56070 level after trading as high as the 57228.28 area during the European session, with the interday high representing a test of the 50-hour simple moving average. Traders drove BTC/USD as low as the 55845 level during yesterday’s Asian session, its lowest print in several sessions and one that follows a succession of lower highs. This level also represented a test of the 61.8% retracement of the recent appreciating range from 55327 to 59249.77. With the psychologically-important 60000 figure back in sight, traders are eyeing technical hurdles around the 59076.15 and 59222.36 areas, representing the 78.6% and 76.4% retracements of the appreciating range from 57653.88 to 64300.
Another important level is the 59441.39 area, representing the 38.2% retracement of the depreciating range from 69000 to 53533. Additional upside retracement levels include the 61266.50, 63091.61, 65349.79, and 65690.06 levels, while additional downside retracement levels include the 49150.78, 44466.36, 38670.39, and 37797.03 areas. Following the pair’s recent volatility, downside retracement levels and areas of potential technical support include the 53150, 52598, 49409, and 49150 levels. Traders are observing that the 50-bar MA (4-hourly) is bearishly indicating below the 100-bar MA (4-hourly) and below the 200-bar MA (4-hourly). Also, the 50-bar MA (hourly) is bullishly indicating above the 100-bar MA (hourly) and above the 200-bar MA (hourly).
Price activity is nearest the 50-bar MA (4-hourly) at 56418.85 and the 200-bar MA (Hourly) at 56411.21.
Technical Support is expected around 53150/ 51245.86/ 49022.22 with Stops expected below.
Technical Resistance is expected around 69000/ 69449.40/ 77565.60 with Stops expected above.
On 4-Hourly chart, SlowK is Bearishly below SlowD while MACD is Bearishly below MACDAverage.
On 60-minute chart, SlowK is Bearishly below SlowD while MACD is Bearishly below MACDAverage.
Disclaimer: This trading analysis is provided by a third party, and for informational purposes only. It does not reflect the views of Crypto Daily, nor is it intended to be used as legal, tax, investment, or financial advice.
Investment Disclaimer
Foundation: A New Trading Paradigm
Bitrue to List Hummingbot Governance Token (HBOT)