
Advertisement
Advertisement
Bitcoin and Ripple Elliott Wave Analysis: Look To Slide More Downside
By:
Crypto market is coming lower as we have been warning for a long time.

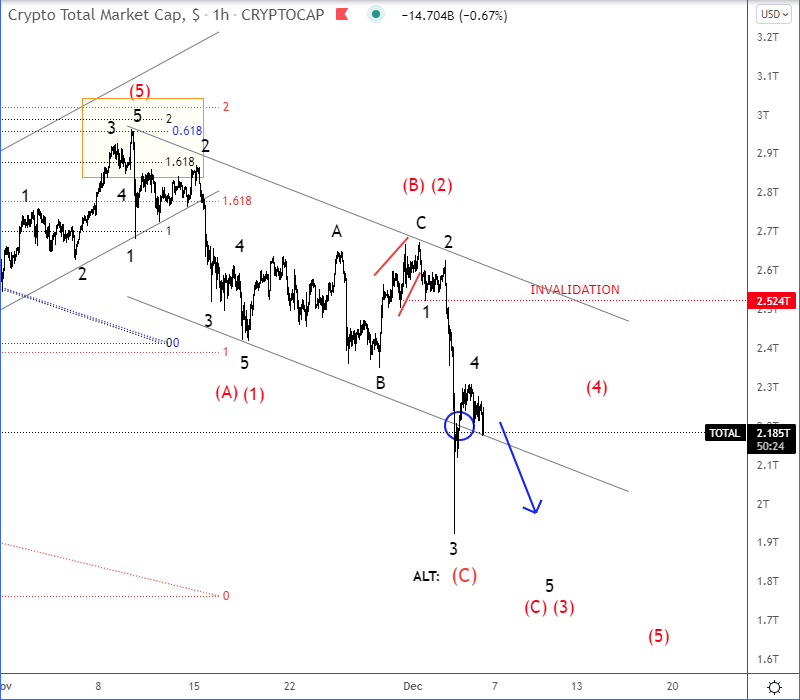
And, with recent sharp decline and broken channel support line on Crypto total market cap chart, there’s a chance for more weakness within a five-wave cycle, but only if the price manages to stay below 2.5T level.
Crypto Total Market Cap 1h Elliott Wave Analysis
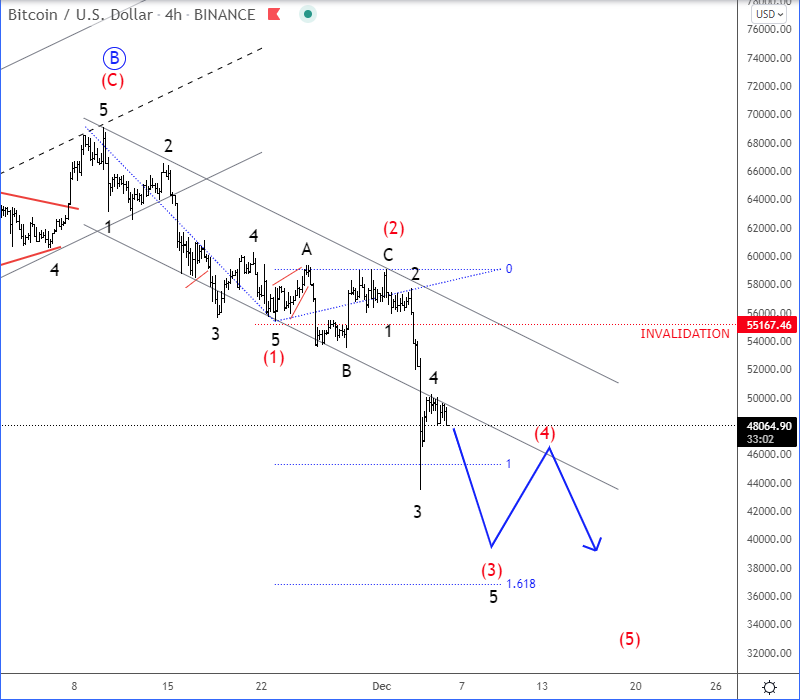
Bitcoin, BTCUSD is accelerating even lower in the 4-hour chart, which was expected based on a projected daily flat correction. So, seems like there’s now room for more weakness within a five-wave cycle for wave C, which can send the price much lower, ideally towards June Lows and 29k-20k support zone, just be aware of shot-term pullback in wave (4). We remain bearish as long as the price is below 55k invalidation level.
Bitcoin 4h Elliott Wave Analysis
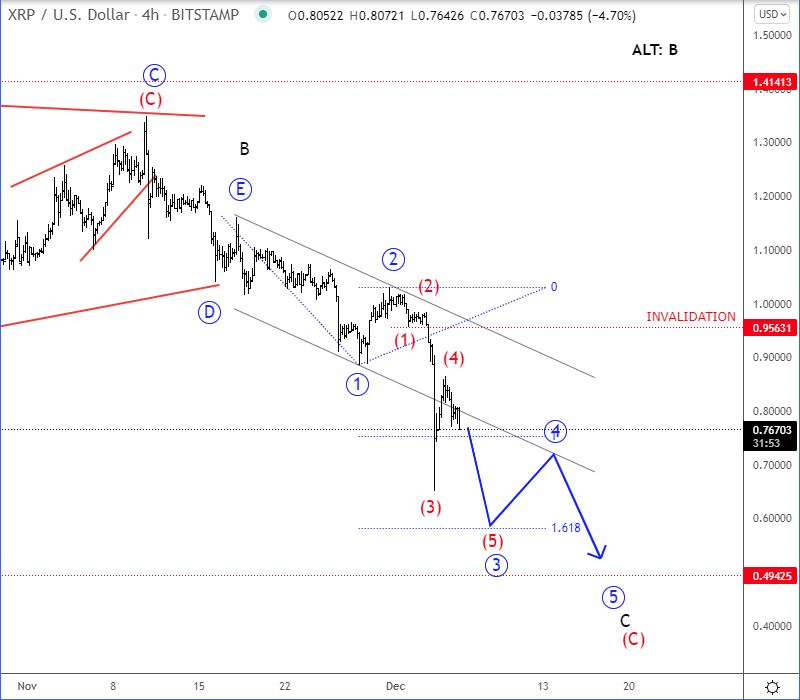
Ripple, XRPUSD is bearish as expected and seems like a bearish triangle in wave B has been completed earlier, so with current acceleration lower in the 4-hour chart, we are tracking a higher degree wave C that can be finished by a five-wave bearish cycle. So, watch out for more downside pressure in upcoming days, ideally towards June lows and 0.50 – 0.20 support area, just be aware of a pullback in wave 4. We remains bearish as long as it’s below 0.95 invalidation level.
Ripple 4h Elliott Wave Analysis
About the Author
Gregor Horvatcontributor
Gregor is based in Slovenia and has been involved in markets since 2003. He is the owner of Ew-Forecast, but before that, he was working for Capital Forex Group and TheLFB.com.
Did you find this article useful?
Latest news and analysis


Advertisement