
Ethereum Chart Provides Clues As To Its Next Direction: Is The Crypto Headed For Blue Skies?

Image by Mohamed Hassan from Pixabay
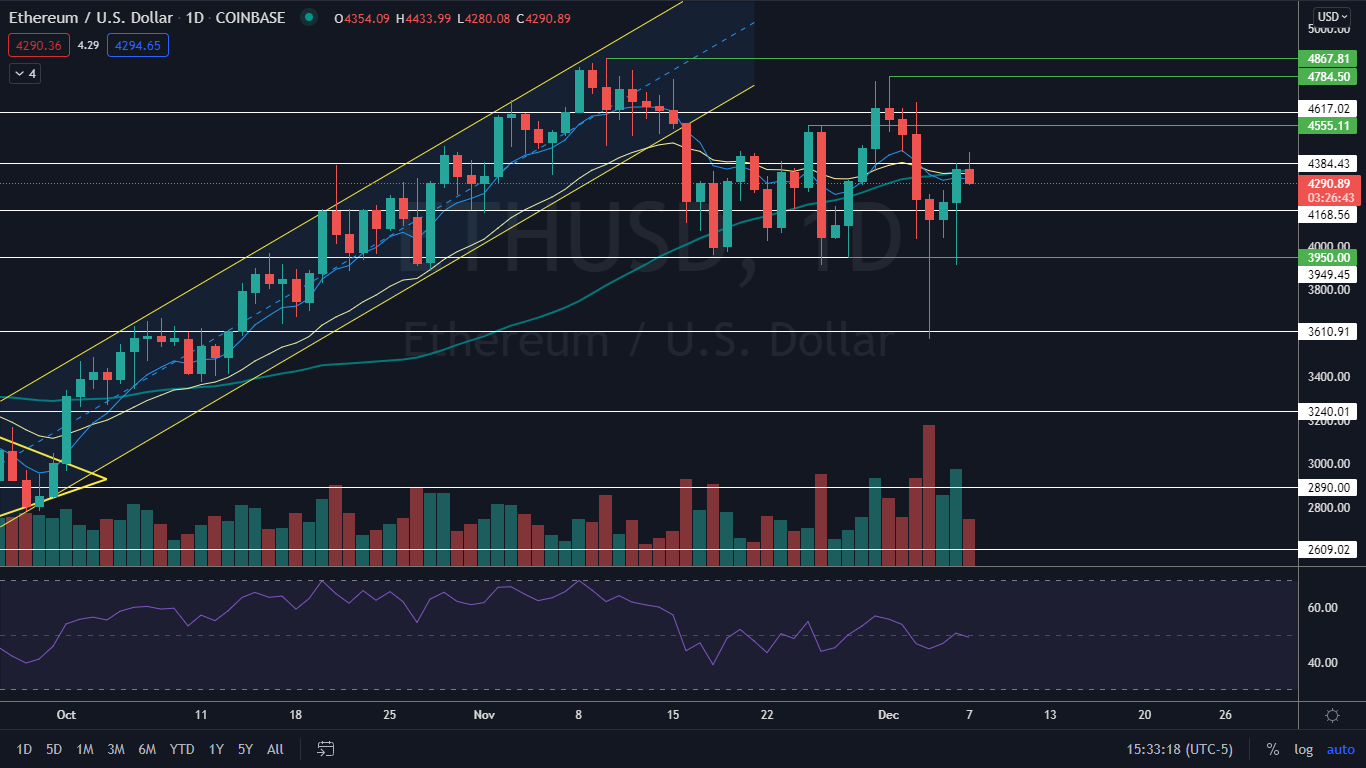
Ethereum ETH has outperformed Bitcoin BTC so far this year, soaring 558% higher between the Jan. 1 opening price of $737.89 and its Nov. 10 all-time high of $4,867.81. Although the crypto is currently trading down about 11% from that level, Ethereum has weathered the market-wide declines and crashes better than other altcoins.
In comparison, Bitcoin ran about 137% higher from its 2021 opening price of $28,990.08 to reach an all-time high of $69,000 on Nov. 10, even though it began its ascent three months earlier than Ethereum on Oct. 1, 2020.
Some analysts predict the Ethereum-Bitcoin “flippening” will eventually take place when Ethereum overtakes Bitcoin in terms of market cap.
Former Goldman Sachs executive and Real Vision founder and CEO Raoul Pal went as far as to predict that would happen during this market cycle.
The flippening likely won’t happen for some time and for Ethereum to make another run at blue skies it will first have to finish a long, mostly sideways, consolidation period in which the crypto has been trading in between $3,950 and $4,617 over the course of the past month.
The Ethereum Chart: Ethereum hasn’t developed a strong trend in either direction as of late but was able to quickly recover from a flash crash that took place near the beginning of the 24-hour trading session on Saturday.
The crash negated the possible uptrend Benzinga called out Nov. 29, although the crypto did make a higher high on Nov. 30 and Dec. 1.
For the crypto to make a higher high on the daily chart it will need to rise up above the $4,784.50 level before printing either a higher low or a lower low.
On Tuesday, Ethereum looked to be printing a dragonfly candlestick on the daily chart, which may indicate the lower high is in. If the pattern is recognized, traders can watch for the crypto to print a higher low and trade into a tightening range or print a lower low and confirm a downtrend.
Either way, Wednesday’s candle will be need to print before technical traders are able to gauge the future direction and it would be ideal if the candle printed on large volume. Tuesday’s volume indicates consolidation because the daily volume is lower-than-average at about 163,552 at 3 p.m. EST compared to a 10-day average of 251,549.
- Bulls want to see either big bullish volume come in and break Ethereum up above the $4,384.43 level or for the crypto to continue consolidating sideways into a tightening pennant pattern. Above the closest upper resistance area there is further resistance at $4,617.02 and the previous all-time high.
- Bears want to see increasing bearish volume come in and drop the crypto down below the $4,168.56 mark. If Ethereum loses the level as support it could retest a lower support area at $$3,949.49.
(Click on image to enlarge)
© 2021 Benzinga.com. Benzinga does not provide investment advice. All rights reserved.


