
GSK Option Bulls Get Head Start On Cup & Handle

Pharma has been one of the best performing industries in recent weeks and GlaxoSmithKline PLC (NYSE: GSK) has been among the top performers. Today, it appears that call buyers are stepping into the stock as it tests its resistance near $43.50. As the price rallies, it is close to confirming a cup-and-handle price pattern. It appears that option traders are expecting it to break out.
Here's a breakdown of the cup-and-handle price pattern.
Cup-and-Handle Basics
Overall Rating: 2 Star
Directional Bias: Bearish
Pattern Type: Non-Directional
(Click on image to enlarge)
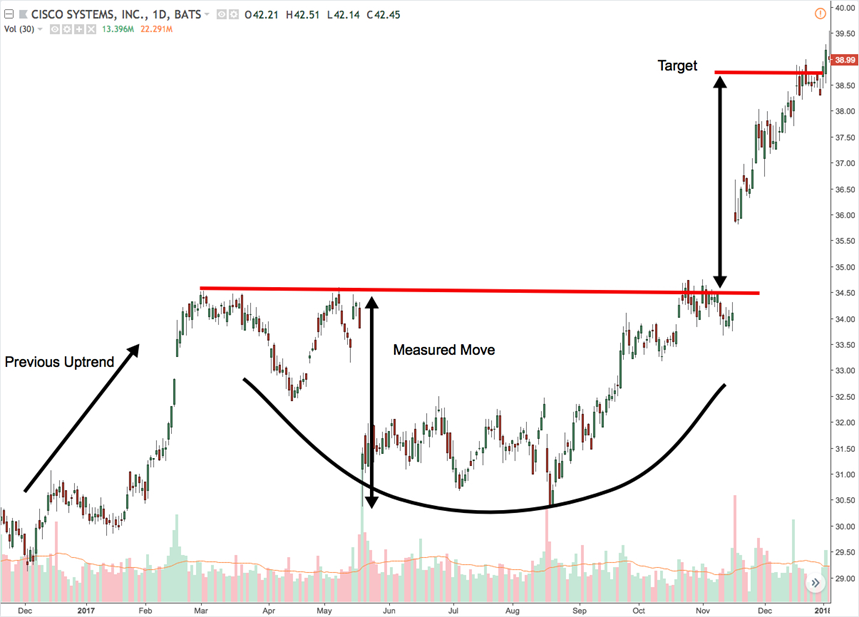
Pattern Description:
This pattern occurs within the context of a longer uptrend and is characterized by the price forming a u-shaped cup with a short handle on the right. The duration of the cup should last at least 7 weeks if using a daily chart.
Volume Description:
Volume will typically follow the shape of the cup, with high volume as the left lip forms, falling volume as the bottom of the cup forms and rising volume toward the right lip and on the breakout.
Breakout Confirmation:
A close above the upper trend-line drawn across the handle with above average volume.
Measuring Technique:
The price target is obtained by measuring the right lip to the bottom of the cup and then added to the price level of the right lip.
Statistical Notes:
The pattern has a low failure rate but doesn’t move as strongly as other patterns. Patterns with shorter handles perform better than longer handles, and deeper cups with the left lip slightly higher than the right lip perform better.
GSK Option Activity
The overall activity has been skewed more bullish as 35% of the volume got filled at the ask and 58% between the market. The call volume was high as well at 4.8 times the 5-day average. With over 30,000 call contracts traded at the time of this writing, nearly a third of the volume occurred on a single call option contract. Here are the details of that activity:
- 8,000 31 DEC 21 $44 calls mostly BOT in 1 print @ $0.30 to $0.60
While the strike isn't that far out-of-the-money, it is an indication that the trade expects the stock to confirm the cup-and-handle formation by the end of the year.
Let's take a look at the chart of GSK.
GSK Cup-and-Handle
As you examine the chart of GSK, you'll notice the rounded bottom of the most recent correction in early November. The price is currently testing the upper resistance and is forming the handle right now. The confirmation would be a breakout above that level on higher volume, similar to December 16. The target based on the cup-and-handle for GSK would be above $46 in the coming weeks.
(Click on image to enlarge)

Conclusion
It's not that this trade is an indication that the price is certain to breakout and complete the projected move. However, the pattern and option activity can provide a basis for a potential trade. Often times, it's the confluence of different types of analysis that can provide a stronger degree of conviction in a trade.
Disclaimer: Neither TheoTrade or any of its officers, directors, employees, other personnel, representatives, agents or independent contractors is, in such capacities, a licensed financial adviser, ...
more

