
Biotechnology Stock Novavax Enters The Buying Area

Image source: Pixabay
Novavax, Inc. is an American biotechnology company. Founded in 1987 and headquartered in Gaithersburg, Maryland, it is a part of Russell 1000 index. Investors can trade it under the ticker NVAX on the Nasdaq and as NVV1 on the XETRA exchange.
Before 2020, the company had developed vaccines to counter such diseases like Ebola, influenza, respiratory syncytial virus (RSV), and others. From 2020 onwards, Novavax has redirected the efforts on development and approval of a Nuvaxovid vaccine for COVID-19.
Even though the company's engagement in the vaccine development is of high public attention, the stock price is in a steady decline from the highs of February 2021. Right now, we see the stock price entering an inflection area. In this article, we present our technical analysis and outlook on the stock.
Novavax Monthly Elliott Wave Analysis - April 24, 2022
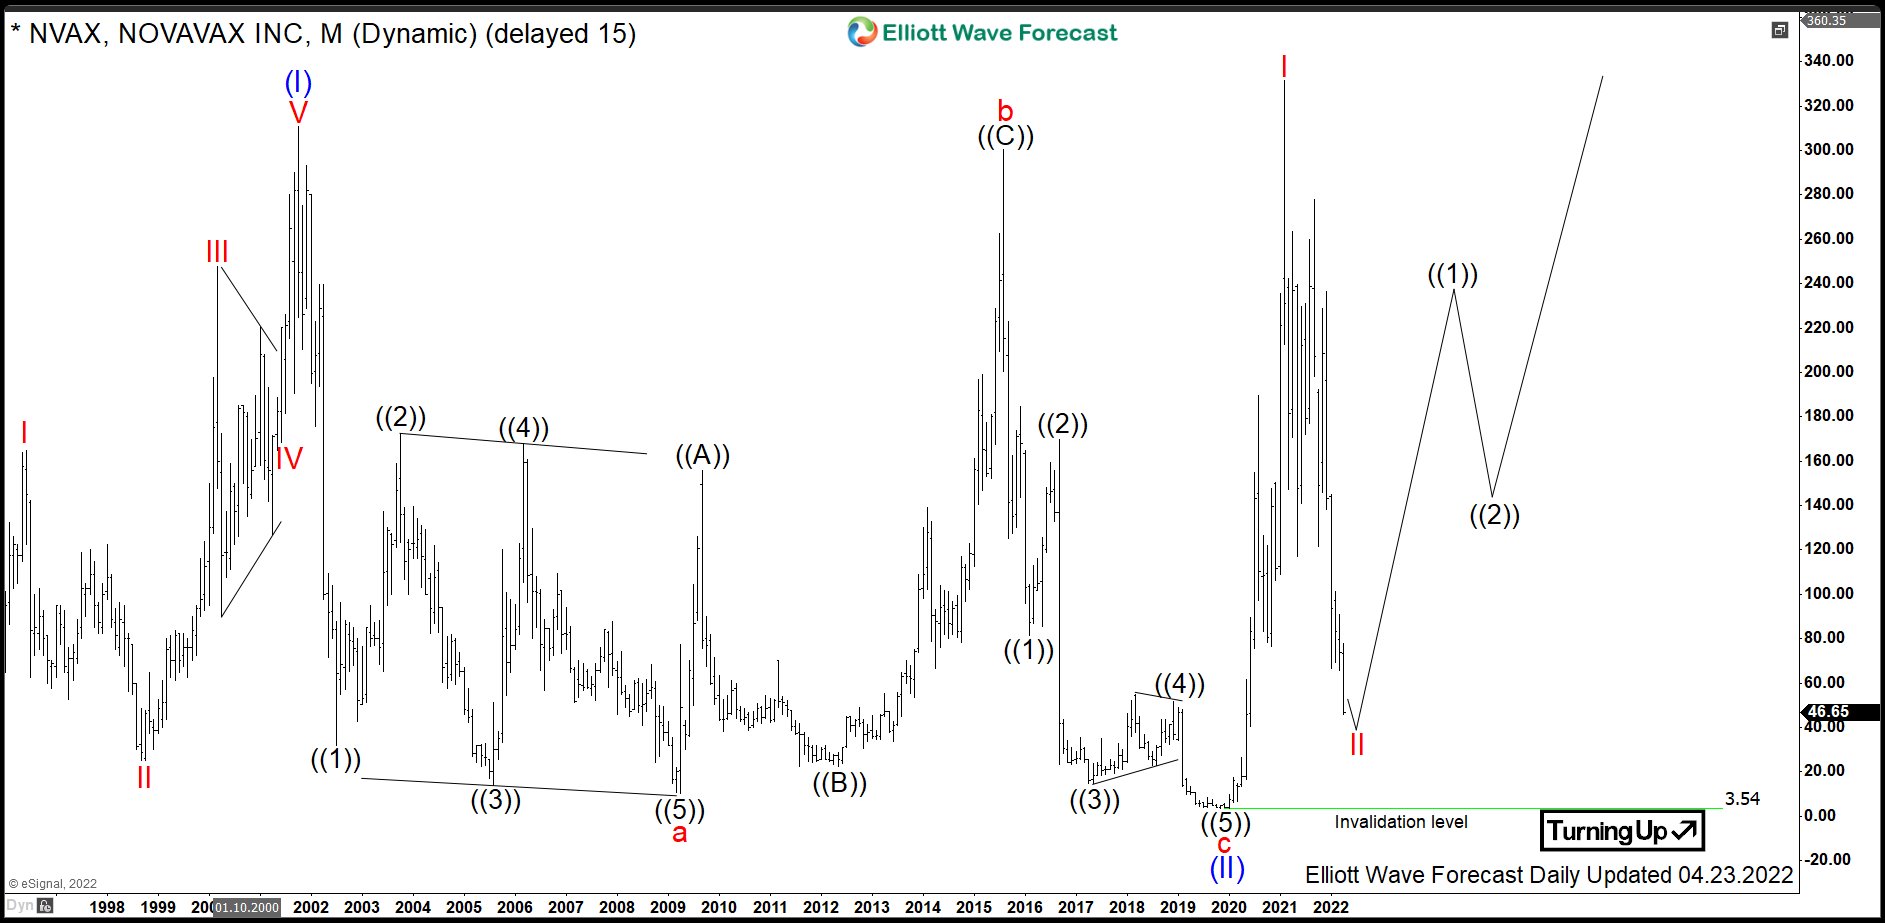
The monthly chart below shows the Novavax stock being traded on the Nasdaq. From the all-time lows, the stock price is showing some nesting price action. First, one can see an Elliott Wave motive wave pattern within the blue wave (I). It had ended on October 2001 at the high of 311. From there, a pullback in wave (II) provided a slow consolidation, which ended in November 2019. During those 18 years, the stock price had lost 99% of its value.
From the lows of November 2019, a new cycle in the blue wave (III) has started. The first stages of that impulsive advance have been discussed in the initial article in April 2020. The price has broken within the red wave I towards new all-time highs.
Hereby, the red wave I has printed its top at 331.68 on February 2021. From there, a pullback in red wave II has been taking place. Investors and traders may obtain a great opportunity to buy Novavax, as we are expecting an acceleration to occur within red wave III.
Novavax Daily Elliott Wave Analysis - April 24, 2022
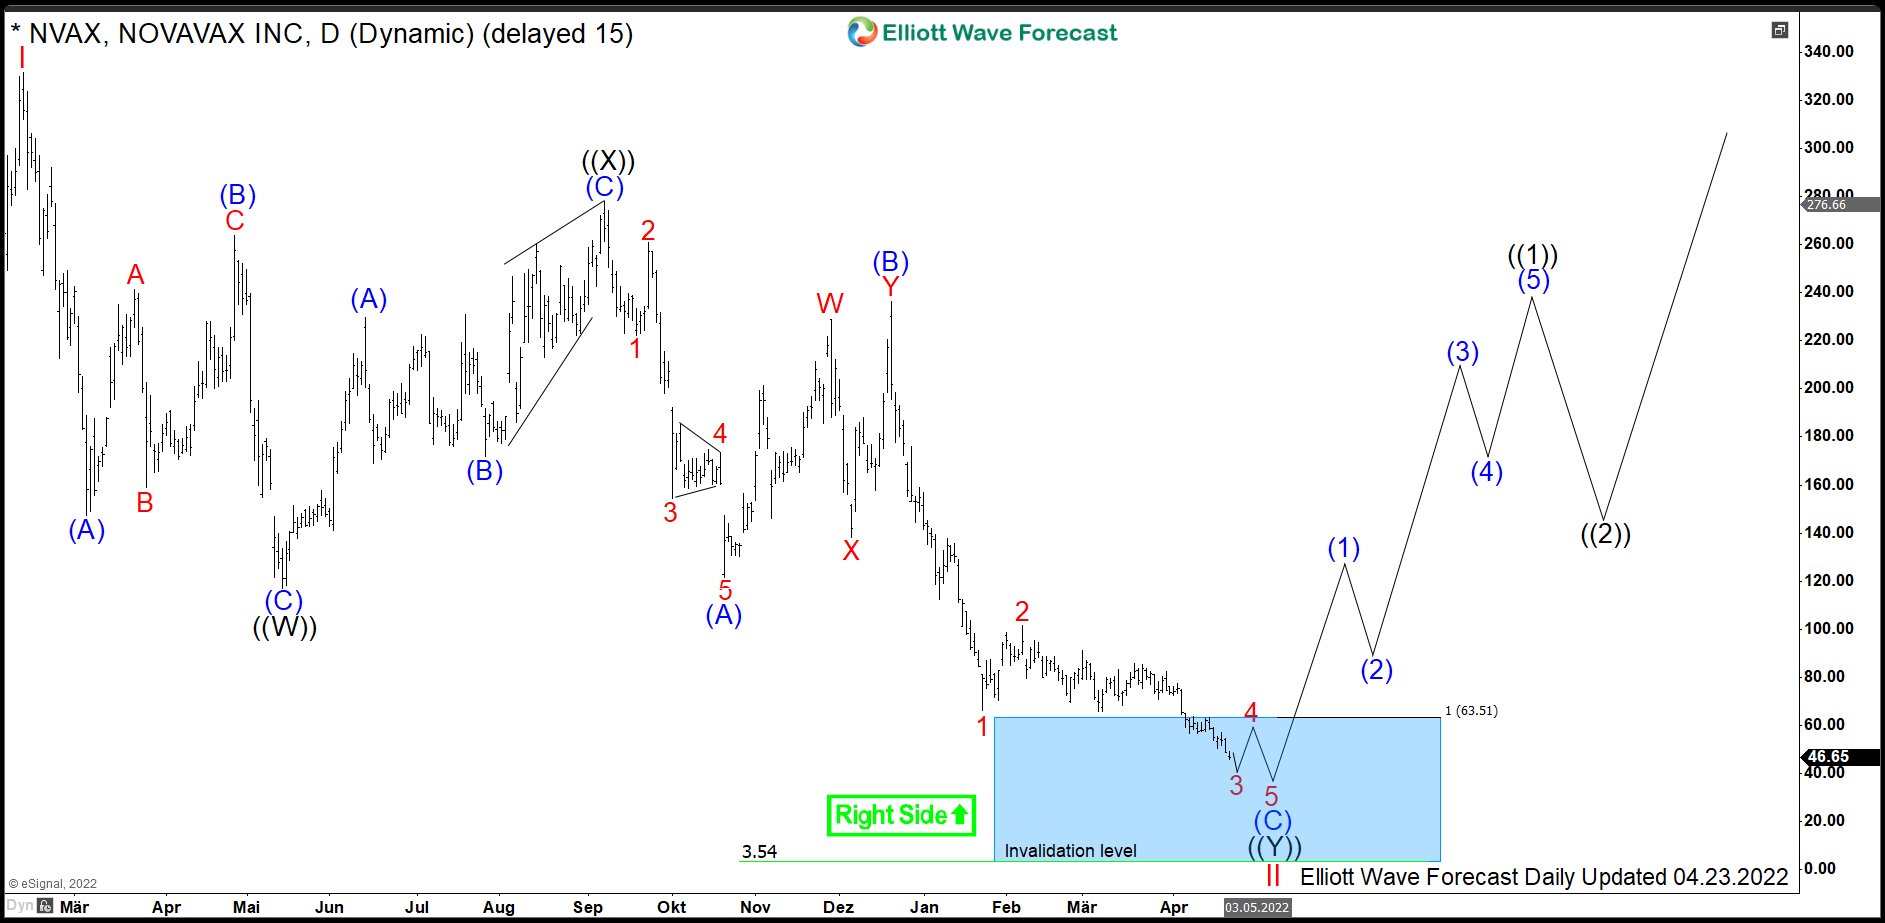
The daily chart below shows the consolidation process within wave II in more detail. The red wave II appears to unfold as an Elliott Wave double-three pattern, which is a 3-3-3 structure. The black waves ((W)) and ((X)) have already finished at this point, and wave ((Y)) appears to be in progress as it reaches towards the 100% extension area of wave ((W)).
Investors and traders may look to buy the stock from 63.51-3.54 area. From there, the stock should accelerate towards the 331.68 level, and possibly even higher.
Disclaimer: Futures, options, and over the counter foreign exchange products may involve substantial risk and may not be suitable for all investors. Leverage can work against you as well as for ...
more

