
Chart Wars: Why Ford And Lucid Stocks Look Ready For Big Moves In 2022

Photos: Ford and Lucid, courtesy manufacturers
Ford Motor Company F and Lucid Group Inc LCID were consolidating on Monday despite the SPDR S&P 500 ETF Trust SPY tanking more than 2% at one point off Friday’s closing price.
The two automakers have outperformed the general markets over the past five trading days with Ford trading up more than 9% and Lucid trading 8.8% higher compared to the SPY, which has plummeted over 4% since reaching an all-time high of $479.98 on Jan. 4.
Ford and Lucid look strong heading into 2022 as the electric vehicle race continues to accelerate, with expectations that consumers will have about 40 types of EVs to choose from by the end of the year.
Ford and Lucid have both settled into bullish patterns on their daily charts and the consolidation taking place on each stock may provide traders with an opportunity to take a position. Ford has created a bullish double bottom pattern while Lucid is settling into an inside bar formation.
It should be noted that events such the general markets turning bearish, negative reactions to earnings prints, and negative news headlines about a stock can quickly invalidate bullish patterns and breakouts. As the saying goes, "the trend is your friend until it isn't," and any trader in a bullish position should have a clear stop set in place and manage their risk versus reward.
In The News: Ford’s highly anticipated F-150 Lightning pickup truck will begin deliveries in the spring, beating competitor General Motors Company GM-owned Chevrolet Silverado to the market by about two years. Both legacy automakers have opened reservations for their pickup trucks and experienced a high level of customer interest.
Lucid, which began deliveries of some of its Lucid Air models in the fourth quarter of 2021 expects to increase production to 20,000 units this year. The electric vehicle start-up, which went public through a SPAC in September 2020, also announced on Twitter on Jan. 4 it plans to expand into the European market later this year.
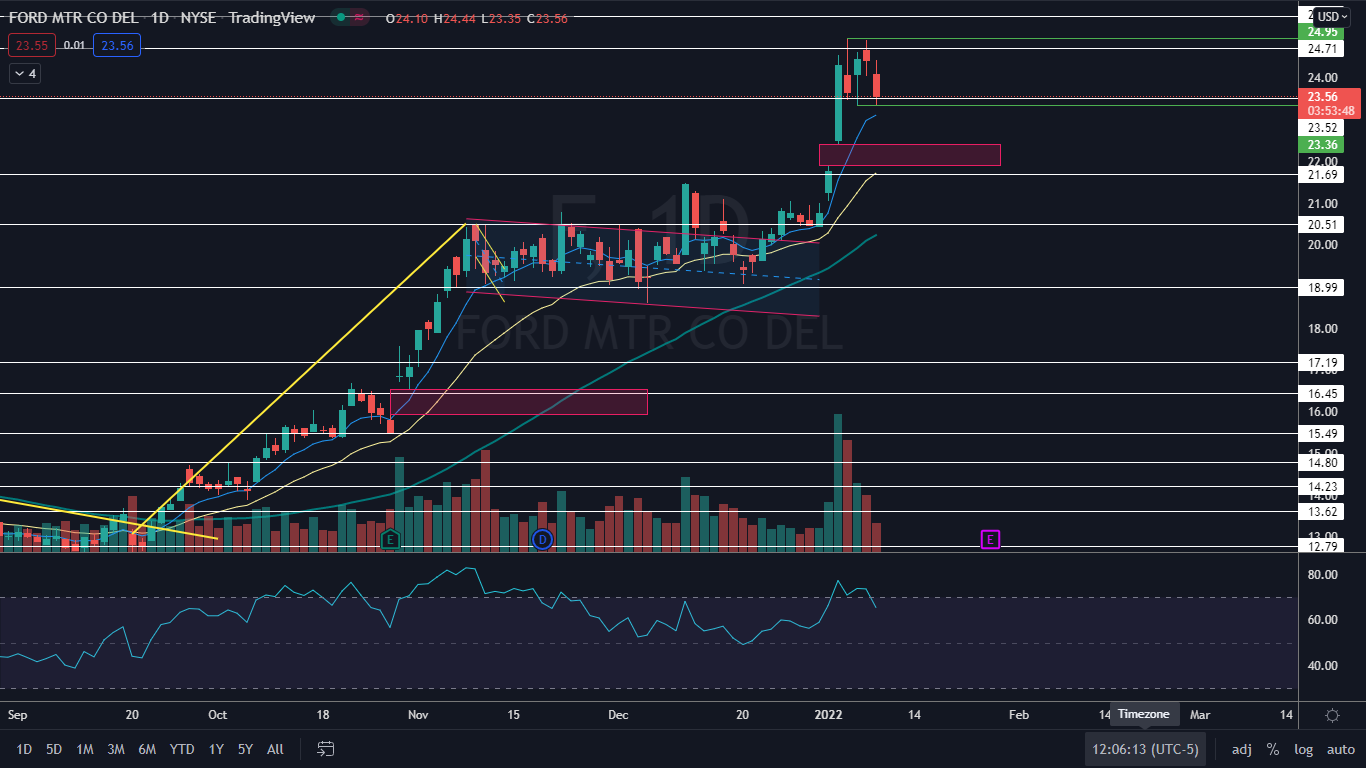
The Ford Chart: On Monday, Ford was consolidating nicely in a sideways trading pattern. The consolidation is needed because the stock’s relative strength index (RSI) has been running high in overbought territory since Jan. 3.
- Monday’s price action paired with the price action on Jan. 6 has created a bullish double bottom pattern at the $23.36 level. The pullback may provide a good opportunity to take a position with a stop below that level.
- There is a gap below on Ford’s chart that may concern some bullish traders because gaps on charts fill about 90% of the time. Ford’s gap is between the $21.88 and $22.42 range.
- Ford has resistance above at $24.71 and $25.49 and support below at $23.52 and $21.69.
(Click on image to enlarge)
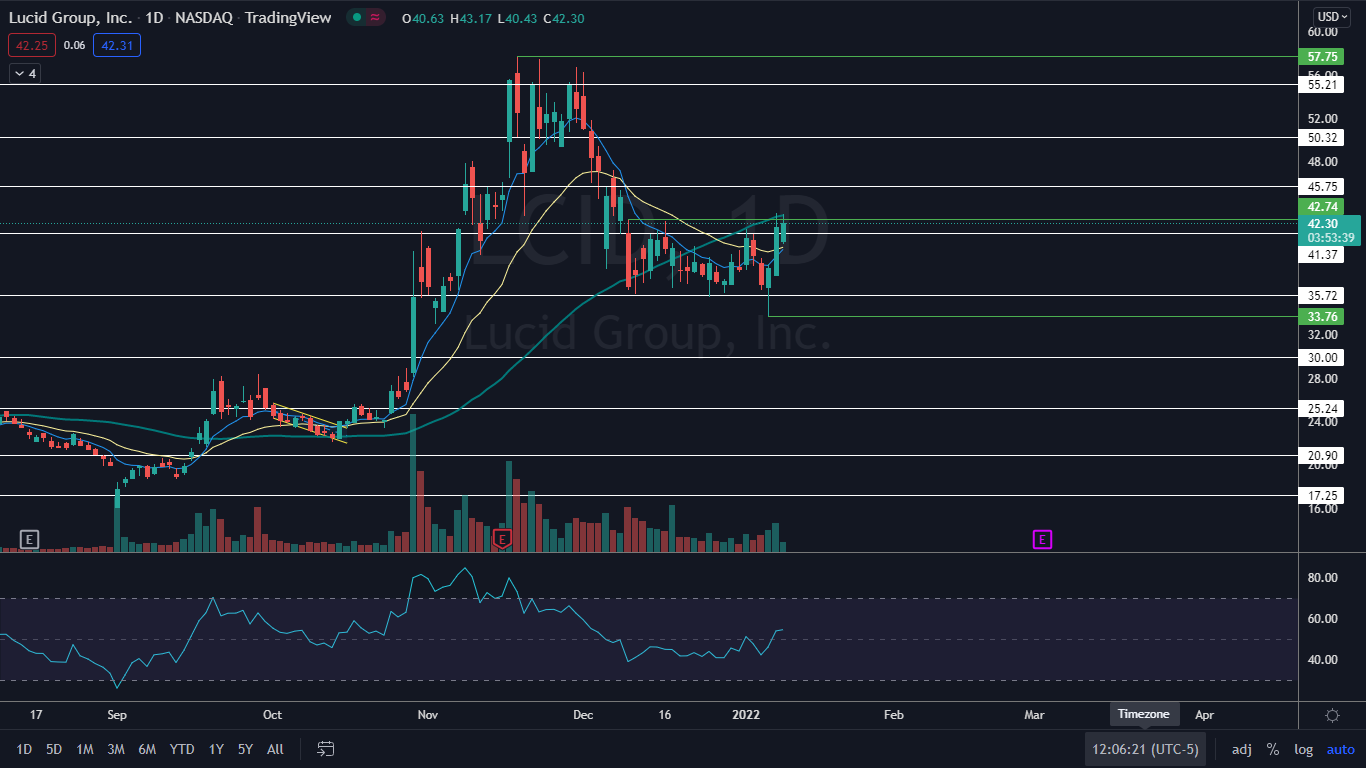
The Lucid Chart: Lucid reached a high of $57.75 on Nov. 17 before entering into a steep downtrend that brought the stock to the $35.72 level. Lucid then traded sideways in consolidation until Jan. 7 when the stock bust up through $42.74 level to print a higher high.
- On Monday, Lucid was printing a bullish inside bar pattern on the daily chart. The inside bar leans bullish because the stock was trading higher before forming the pattern.
- Eventually Lucid will need to print a higher low above the Jan. 6 low-of-day at $33.76, which could give bullish traders an opportunity to take a position with a stop below that level.
- Lucid has resistance above at $45.74 and $50.32 and support below at $41.37 and $35.72.
(Click on image to enlarge)
© 2022 Benzinga.com. Benzinga does not provide investment advice. All rights reserved.


