- The Australian dollar grinds higher as the Asian Pacific session begins.
- AUD/JPY Technical Outlook: The downward move capped at the 200-DMA spurred the AUD surge above the 83.00 figure, so the pair is upward bias.
As the Asian Pacific session began and the New York session ended, the Australian dollar recovered some ground against the so-called safe-haven Japanese yen. At press time, he AUD/JPY is trading at 83.19. US equity indices finished the Wall Street session in the green, recording gains between 0.51% and 1.47%, whereas Asian stock futures point to a higher open.
AUD/JPY Price Forecast: Technical outlook
On Tuesday, the cross-currency pair was subdued in the 83.50-90 range during the overnight session. But an improvement in the market mood late in the Asian session, early Europe, alongside a rebound from tech-stocks, spurred demand for risk-sensitive peers, benefitting the Antipodeans, alongside the CAD.
That said, the AUD/JPY broke the top of the trading range and reclaimed the 83.00 figure.
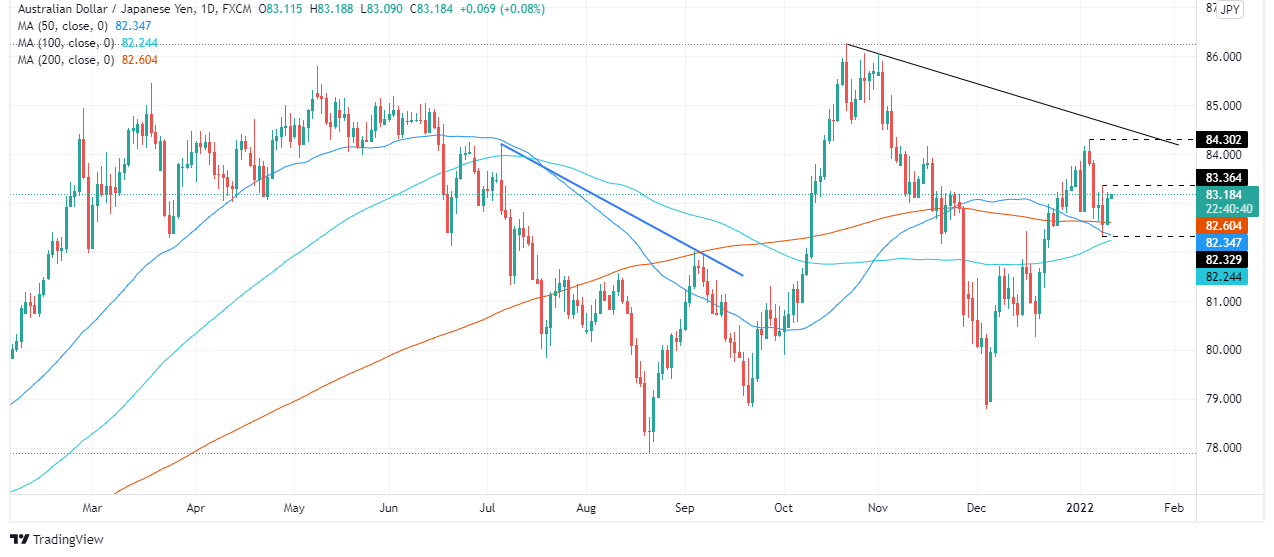
The AUD/JPY is bullish biased. The pair dipped to the 200-day moving average (DMA) but was rejected, rallying towards resistance above 83.00. The first resistance would be the January 10 daily high at 83.36. A clear break above it would expose a four-month-old downslope trendline drawn, from October 2021 highs, near the psychological 84.00 area.
Conversely, the immediate support would be 83.00. A breach of the latter could send the AUD/JPY tumbling to the 200-DMA at 82.65. Once the level gives way to JPY bulls, the next stop would be the confluence of the 100-DMA and the January 10 daily low around 82.33, followed by 82.00.
Information on these pages contains forward-looking statements that involve risks and uncertainties. Markets and instruments profiled on this page are for informational purposes only and should not in any way come across as a recommendation to buy or sell in these assets. You should do your own thorough research before making any investment decisions. FXStreet does not in any way guarantee that this information is free from mistakes, errors, or material misstatements. It also does not guarantee that this information is of a timely nature. Investing in Open Markets involves a great deal of risk, including the loss of all or a portion of your investment, as well as emotional distress. All risks, losses and costs associated with investing, including total loss of principal, are your responsibility. The views and opinions expressed in this article are those of the authors and do not necessarily reflect the official policy or position of FXStreet nor its advertisers. The author will not be held responsible for information that is found at the end of links posted on this page.
If not otherwise explicitly mentioned in the body of the article, at the time of writing, the author has no position in any stock mentioned in this article and no business relationship with any company mentioned. The author has not received compensation for writing this article, other than from FXStreet.
FXStreet and the author do not provide personalized recommendations. The author makes no representations as to the accuracy, completeness, or suitability of this information. FXStreet and the author will not be liable for any errors, omissions or any losses, injuries or damages arising from this information and its display or use. Errors and omissions excepted.
The author and FXStreet are not registered investment advisors and nothing in this article is intended to be investment advice.
Recommended content
Editors’ Picks
EUR/USD clings to daily gains above 1.0650

EUR/USD gained traction and turned positive on the day above 1.0650. The improvement seen in risk mood following the earlier flight to safety weighs on the US Dollar ahead of the weekend and helps the pair push higher.
GBP/USD recovers toward 1.2450 after UK Retail Sales data

GBP/USD reversed its direction and advanced to the 1.2450 area after touching a fresh multi-month low below 1.2400 in the Asian session. The positive shift seen in risk mood on easing fears over a deepening Iran-Israel conflict supports the pair.
Gold holds steady at around $2,380 following earlier spike

Gold stabilized near $2,380 after spiking above $2,400 with the immediate reaction to reports of Israel striking Iran. Meanwhile, the pullback seen in the US Treasury bond yields helps XAU/USD hold its ground.
Bitcoin Weekly Forecast: BTC post-halving rally could be partially priced in Premium

Bitcoin price shows no signs of directional bias while it holds above $60,000. The fourth BTC halving is partially priced in, according to Deutsche Bank’s research.
Week ahead – US GDP and BoJ decision on top of next week’s agenda

US GDP, core PCE and PMIs the next tests for the Dollar. Investors await BoJ for guidance about next rate hike. EU and UK PMIs, as well as Australian CPIs also on tap.