
The GBPUSD is working on its third day higher and four of the last five trading days. Since the recent corrective low on January 6 at 1.3489, the price has moved to a high today of 1.37479 (or 259 pips).
Looking at the daily chart, the move up over that time period has taken the price above its
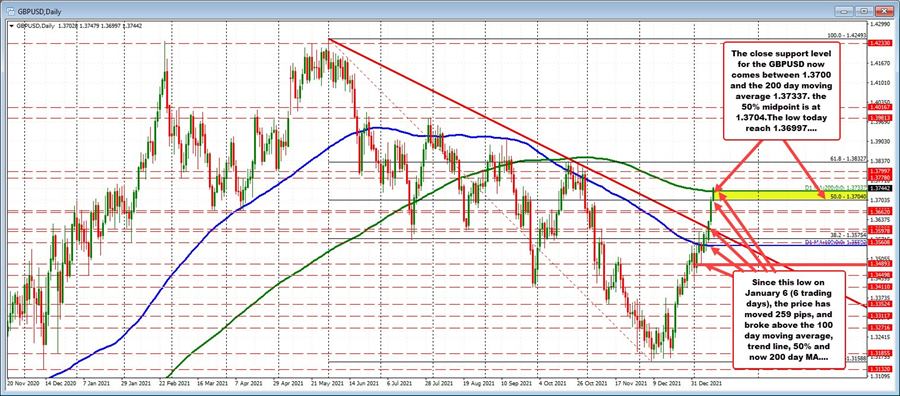
- 100 day moving average at 1.3550,
- A downward sloping trendline,
- The 50% retracement of the move down from the June 2021 high at 1.3704, and more recently,
- The 200 day moving average at 1.37337
The move above the 200 day moving averages the first since September 17. Back in October, the price moved up to test that moving average only to find early sellers against the level. That led to the trend move down to the December low at 1.31588.
Traders will be watching the 200 day moving average as close support, but understand that the price has traded above and below that level today (see hourly chart below). A more conservative risk defining level would be on a move back below the 50% retracement 1.3704 (and maybe below the natural support at 1.3700). The low price today came in at 1.36997.
Drilling to the hourly chart below, the price low on Tuesday stalled against its 100 day moving average. That was a catalyst for more buying.
Getting above 1.3600 and staying above on Tuesday and then 1.36188, give the buyers more confidence. The letter level held support during trading yesterday before moving higher (see red numbered circle seven). Currently the prices leaning against the earlier highs for the day at 1.37479 with the 200 day right below at 1.37338.
The buyers are making another play. Can they shove the price above the highs and move further away from the key 200 day moving average? If so, a swing area between 1.3778 at 1.37997 would be the next upside target area.


