- The USD/CHF fall ended after three consecutive days amid a risk-off market mood.
- The rise of the 10-year US Treasury yield underpins the greenback.
- USD/CHF is neutral biased, but a bullish-engulfing candle pattern may open the door for an upside move; otherwise, it could challenge August 2021 monthly lows.
The USD/CHF snaps three straight days of losses, edges higher during the New York session, trading at 0.9139 at press time. A risk-off market mood, increased demand for safe-haven assets, usually benefits the CHF and the JPY, but not on Friday, with the USD recovering from earlier week losses.
The USD Dollar Index, a gauge of the greenback’s performance against six other currencies, advances som 0.29%, up to 95.96, underpinned by the 10-year benchmark note, which is rising 3.4 basis points, sitting at 1.754%.
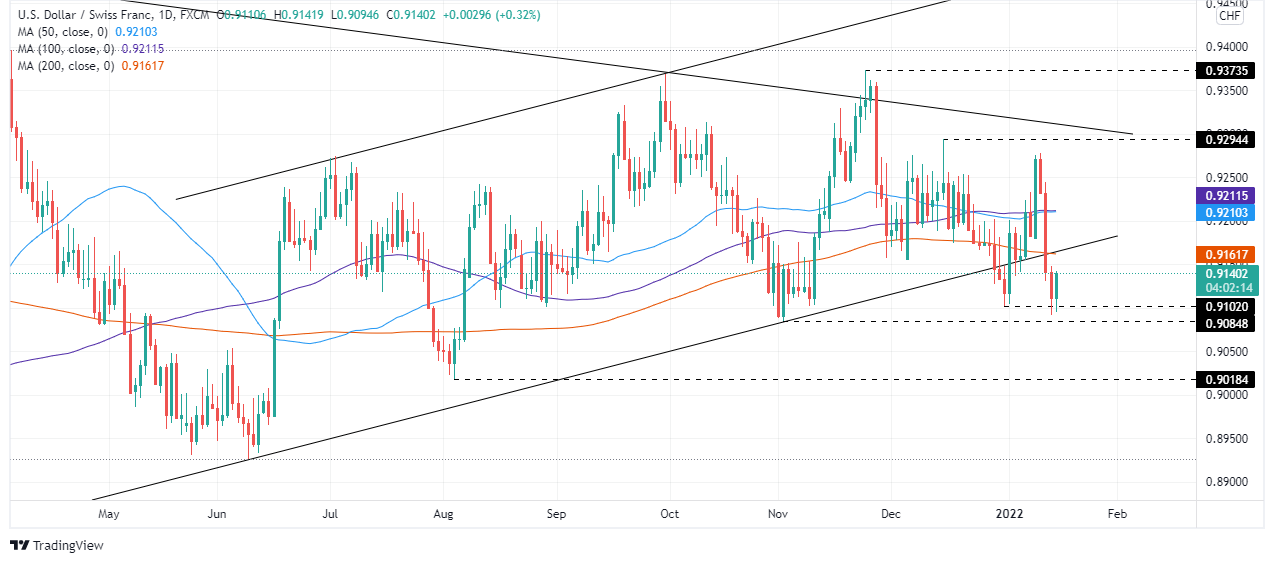
USD/CHF Price Forecast: Technical outlook
The USD/CHF daily chart depicts the consolidation of the pair inside an ascending channel; even though it was “pierced” on the bottom trendline, USD bears have not achieved a daily close under 0.9080.
If USD/CHF Friday’s daily close engulf Thursday’s candlestick price action, an upward move may be on the cards. In that outcome, the first resistance would be the 200-day moving average (DMA) previously broke at 0.9167. An aforementioned break would expose the confluence of th3 50 and the 100-DMA in the 0.9210-12 range, which once gave way to USD bulls, would send the pair rallying towards December 15, 2021 daily high at 0.9294.
Contrarily, failure of the abovementioned scenario would keep the USD/CHF neutral-downward biased. The USD/CHF first line of defense would be 0.9100. A breach of the latter would exert further downside pressure on the pair, exposing crucial support levels. The next one would be November 2, 2021, daily low at 0..9084, followed by August 4, 2021, cycle low at 0.9018.
Information on these pages contains forward-looking statements that involve risks and uncertainties. Markets and instruments profiled on this page are for informational purposes only and should not in any way come across as a recommendation to buy or sell in these assets. You should do your own thorough research before making any investment decisions. FXStreet does not in any way guarantee that this information is free from mistakes, errors, or material misstatements. It also does not guarantee that this information is of a timely nature. Investing in Open Markets involves a great deal of risk, including the loss of all or a portion of your investment, as well as emotional distress. All risks, losses and costs associated with investing, including total loss of principal, are your responsibility. The views and opinions expressed in this article are those of the authors and do not necessarily reflect the official policy or position of FXStreet nor its advertisers. The author will not be held responsible for information that is found at the end of links posted on this page.
If not otherwise explicitly mentioned in the body of the article, at the time of writing, the author has no position in any stock mentioned in this article and no business relationship with any company mentioned. The author has not received compensation for writing this article, other than from FXStreet.
FXStreet and the author do not provide personalized recommendations. The author makes no representations as to the accuracy, completeness, or suitability of this information. FXStreet and the author will not be liable for any errors, omissions or any losses, injuries or damages arising from this information and its display or use. Errors and omissions excepted.
The author and FXStreet are not registered investment advisors and nothing in this article is intended to be investment advice.
Recommended content
Editors’ Picks
AUD/USD hovers around 0.6500 amid light trading, ahead of US GDP

AUD/USD is trading close to 0.6500 in Asian trading on Thursday, lacking a clear directional impetus amid an Anzac Day holiday in Australia. Meanwhile, traders stay cautious due ti risk-aversion and ahead of the key US Q1 GDP release.
USD/JPY finds its highest bids since 1990, near 155.50

USD/JPY keeps breaking into its highest chart territory since June of 1990 early Thursday, testing 155.50 for the first time in 34 years as the Japanese Yen remains vulnerable, despite looming Japanese intervention risks. Focus shifts to Thursday's US GDP report and the BoJ decision on Friday.
Gold price treads water near $2,320, awaits US GDP data

Gold price recovers losses but keeps its range near $2,320 early Thursday. Renewed weakness in the US Dollar and the US Treasury yields allow Gold buyers to breathe a sigh of relief. Gold price stays vulnerable amid Middle East de-escalation, awaiting US Q1 GDP data.
Injective price weakness persists despite over 5.9 million INJ tokens burned
Injective price is trading with a bearish bias, stuck in the lower section of the market range. The bearish outlook abounds despite the network's deflationary efforts to pump the price. Coupled with broader market gloom, INJ token’s doomed days may not be over yet.
Meta Platforms Earnings: META sinks 10% on lower Q2 revenue guidance Premium

This must be "opposites" week. While Doppelganger Tesla rode horrible misses on Tuesday to a double-digit rally, Meta Platforms produced impressive beats above Wall Street consensus after the close on Wednesday, only to watch the share price collapse by nearly 10%.