Join Our Telegram channel to stay up to date on breaking news coverage
Bitcoin Cash Price Prediction – January 19
The Bitcoin Cash prediction reveals that BCH is currently below $380 as the coin may be entering deeply into the negative side.
BCH/USD Market
Key Levels:
Resistance levels: $450, $500, $550
Support levels: $300, $250, $200
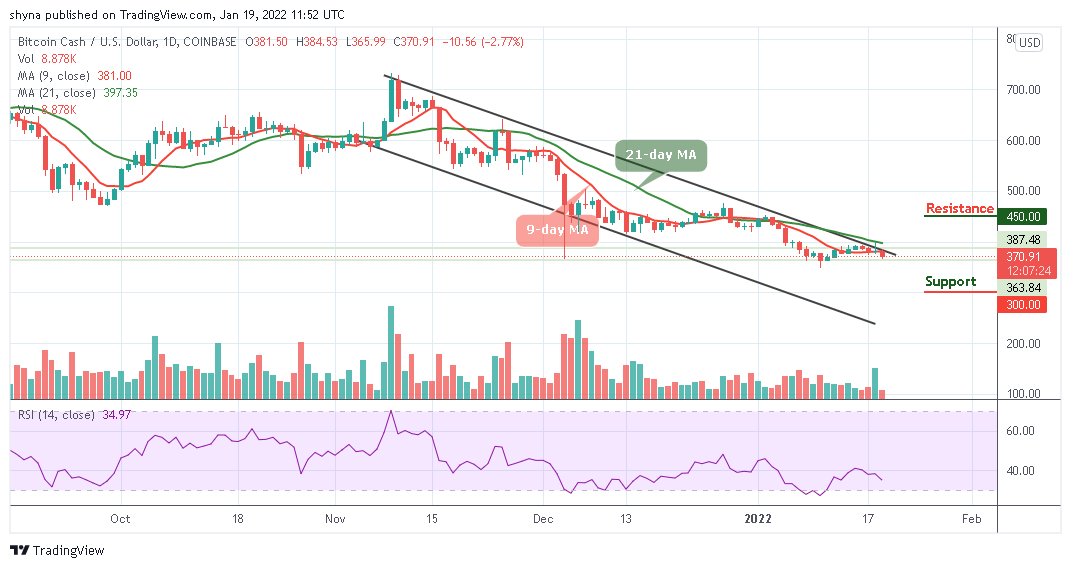
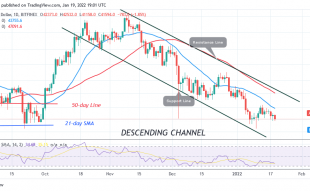
BCH/USD is still following a downtrend as bears now move to dominate the entire cryptocurrency landscape. Presently, the Bitcoin Cash price is hovering below the 9-day and 21-day moving averages as the trend has a bearish inclination, which may likely touch the support at $350. However, the technical indicator remains bearish as the Relative Strength Index (14) may dip into the oversold region.
Bitcoin Cash Price Prediction: BCH Price Could Spike Below $350
The Bitcoin Cash price is currently hovering at $370; the daily chart shows that the coin is trading below the upper boundary of the channel. At the time of writing, the market price nosedives below the 9-day ad 21-day moving averages, issuing a sell signal as the technical indicator Relative Strength Index (14) slumps below the 40-level.
Moreover, a minimum swing may likely bring the market to $350 support level. Therefore, moving below this level could take the bears to $300, $250, and $200 levels. On the other hand, a high swing may likely take the bulls to cross above the upper boundary of the channel. Above this, the coin can possibly trigger a bullish rally which may take the price to $450, $500, and $550 resistance levels.
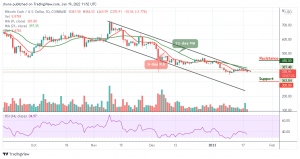
When compares with Bitcoin, the daily chart reveals that bears continue to push the price towards the south. The daily chart reveals that the trend may continue to follow the downtrend as buyers were unable to push the price above 9-day and 21-day moving averages.
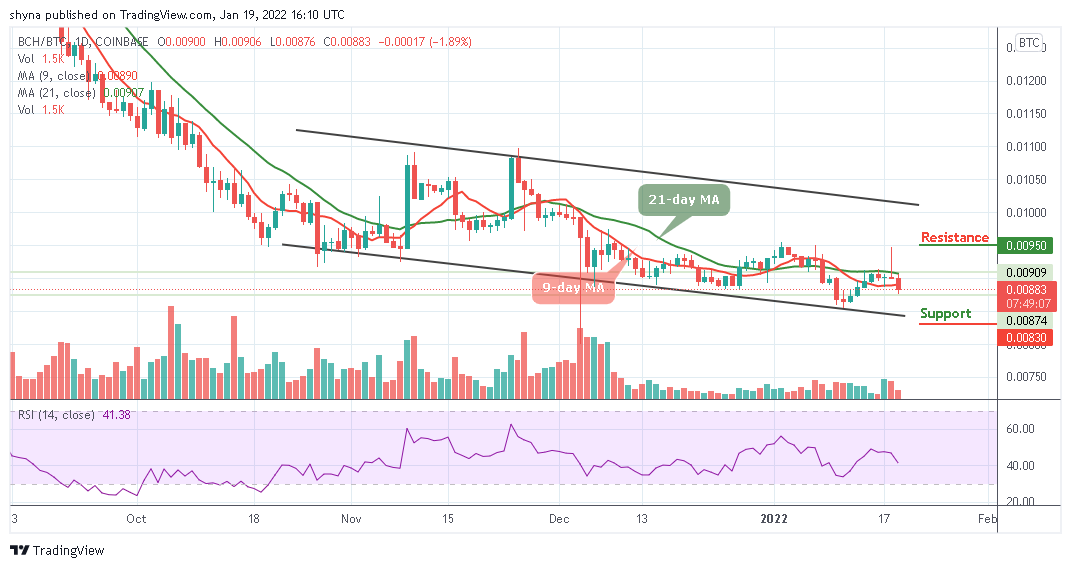
However, as the technical indicator Relative Strength Index (14) moves to cross below 40-level, it is likely to move toward the oversold region and a bearish continuation could lower the price to the support level of 830 SAT and below, but if it crosses above the 9-day and 21-day moving averages, the market price may likely begin an upward trend which could push the coin towards the resistance level of 950 SAT and above.
Looking to buy or trade Bitcoin Cash (BCH) now? Invest at eToro!
68% of retail investor accounts lose money when trading CFDs with this provider
Read more:
Join Our Telegram channel to stay up to date on breaking news coverage