
Ford's Stock Pulls Back, But Here's Why Bulls May Soon Regain Control

Photo: Courtesy of Mike Mozart on Flickr
Ford Motor Co (F) shares retreated over 7% by Wednesday afternoon as the stock took aim at a lower gap between $21.88 and $22.42 that was left behind on Jan. 4 when shares shot up almost 12% higher from the previous day’s closing price.
If the stock falls to fill the gap and prints a reversal signal near a support level at $21.69, it could provide a solid entry point for investors waiting to take a long position over 2022 as the legacy automaker continues to ramp up its electric vehicle production.
The EV sector is largely dominated by Tesla, Inc (TSLA) currently, but on Wednesday BofA Securities analyst, John Murphy, said in a note that he expects Ford and its closest competitor General Motors Co (GM) to be the biggest gainers in terms of market share.
Ford is expected to announce its quarterly earnings results after the closing bell on Feb. 3. On Tuesday, the Detroit-based automaker said it intends to include a number of large special items in its report. This will include Ford’s $8.2 billion gain from its equity investment in Rivian Automotive Inc (RIVN).
Despite the positive news, stocks very rarely go up in a straight line for any period of time as investors take profits and sell winning positions. The declines can provide entry points for investors, as long as they have clear stops set in place in case the trade goes south.
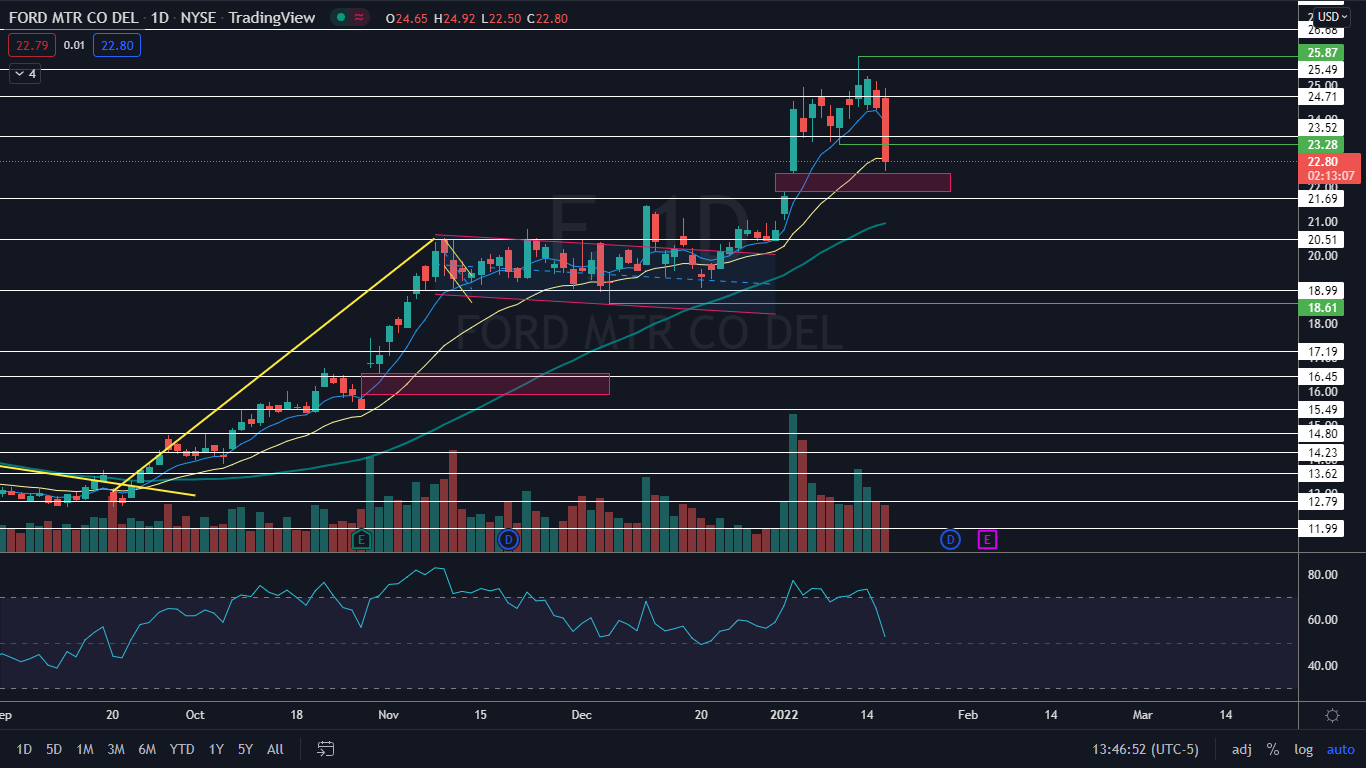
The Ford Chart
On Wednesday, Ford broke bearishly from an inside bar pattern, which likely spooked some investors. The fall lower, however, was made on lower-than-average volume intraday, which suggests that the long-term uptrend is likely still intact.
Although Wednesday’s move lower negated the uptrend on the daily chart by falling below the Jan. 11 low-of-day at $23.28, Ford is still trading in a weekly uptrend and was in need of a higher low to continue on its trajectory. For the uptrend to continue, Ford must hold above the most recent weekly higher low that was printed Dec. 6 at $18.61.
The price action allowed Ford’s relative strength index (RSI) to drop from the 70%-76% range it reached on Jan. 3 and Jan. 14 to the 50% level. When a stock’s RSI gets to or exceeds the 70% level, it becomes overbought, which can be a sell signal for technical traders. The stock has room on its RSI to move higher again now, which is a bullish signal, although it should be noted the RSI could also fall lower if the stock continues to decline.
Ford is trading below the eight-day and 21-day exponential moving averages (EMAs) but the eight-day EMA is trending above the 21-day, which indicates indecision. If Ford is unable to rise back up above the eight-day EMA over the coming days, it will eventually cross below the 21-day EMA, which would be bearish.
Bulls want to see the move lower consolidated on low volume and then for big bullish volume to come in and push Ford back up over the eight-day EMA. There is resistance above at $23.52 and $24.71.
Bears want to see big bearish volume come in and drop the stock below support at $21.69 and then for momentum to push Ford below the most recent weekly higher low to negate the long-term uptrend. Ford has further support at $20.51 and $18.99.
© 2022 Benzinga.com. Benzinga does not provide investment advice. All rights reserved.


