
LTC/USD Rally May Fail For More Downside
Short Term view in LTCUSD (LTC-X) suggests decline from November 10, 2021 high is unfolding as a zigzag structure. Down from November 10, 2021 high, wave (A) ended at 120.49 as the 2 hour chart below shows. Wave (B) bounce ended at 154.13 with internal subdivision as a double three structure. Up from wave (A), wave ((a)) ended at 133.49, wave ((b)) dips ended at 130.71, and wave ((c)) ended at 142.22. This completed wave W in higher degree. Pullback in wave X ended at 134.65. The cryptocurrency then extended higher in wave Y with subdivision as a zigzag in lesser degree. Up from wave X, wave ((a)) ended at 150.70, wave ((b)) ended at 143.35, and wave ((c)) ended at 154.13. This completed wave Y and also wave (B) in higher degree.

Photo by Michael Förtsch on Unsplash
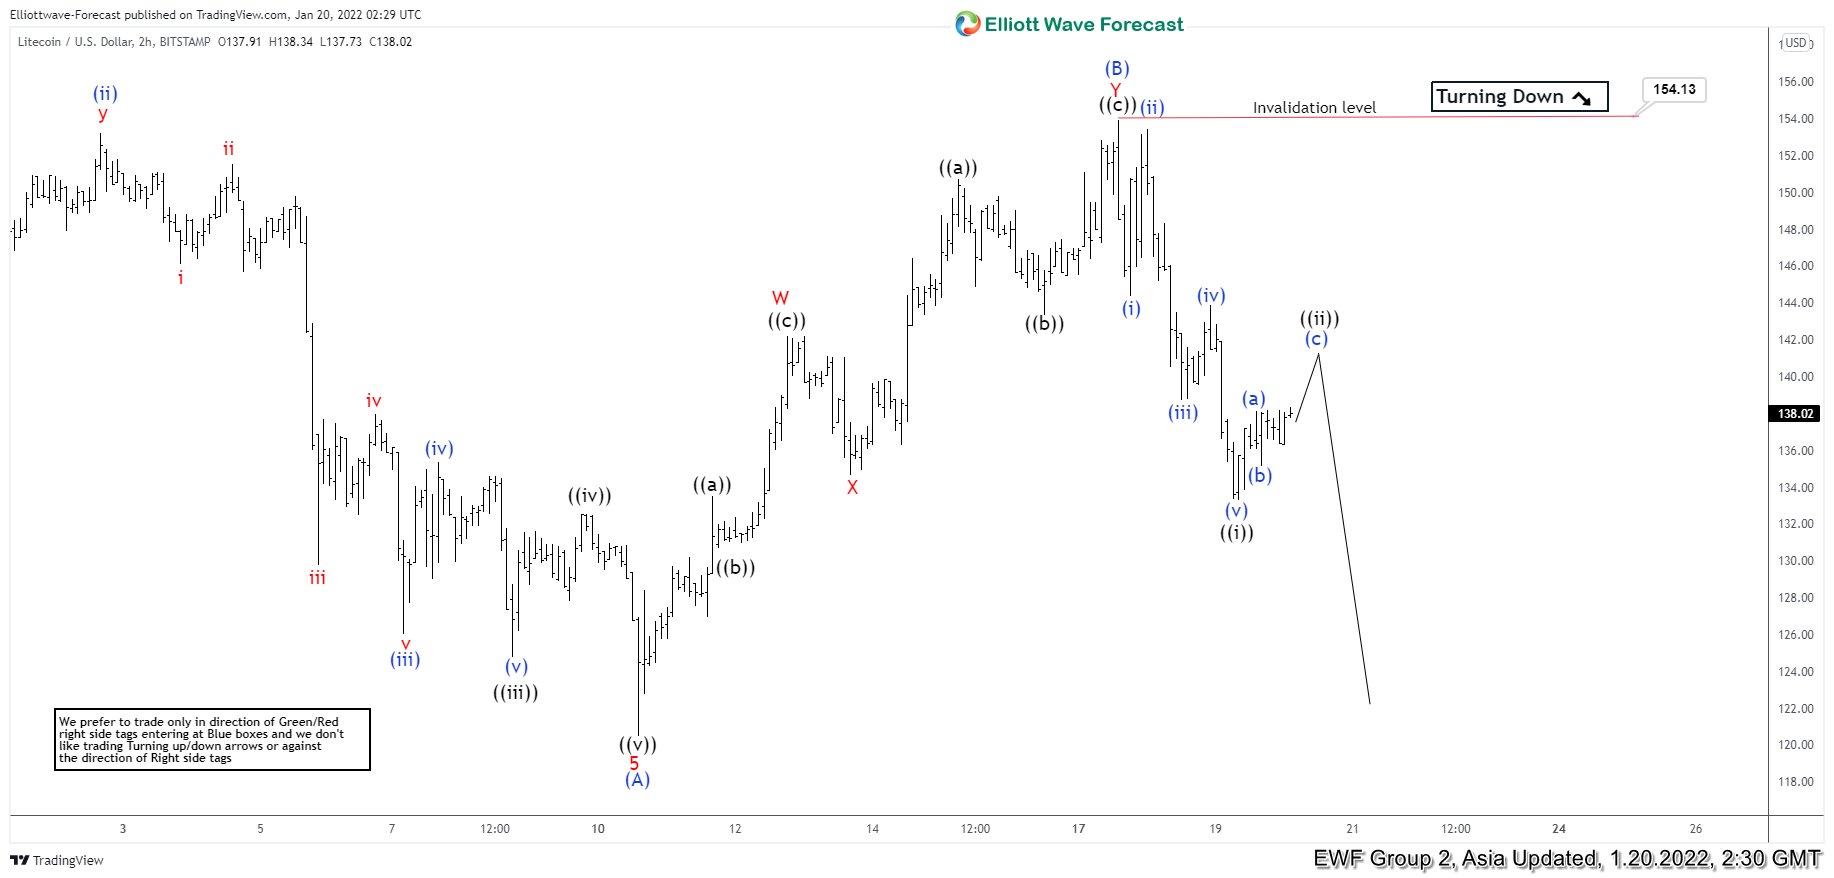
Litecoin has turned lower in wave (C) but it still needs to break below wave (A) at 120.49 to validate the view and rule out a double correction. Down from wave (B), wave (i) ended at 144.39 and rally in wave (ii) ended at 155.43. Wave (iii) lower ended at 138.74, wave (iv) ended at 143.90, and wave (v) ended at 133.27. This completed wave ((i)) in higher degree. Rally in wave ((ii)) is in progress to correct cycle from January 17, 2022 high before the decline resumes. Near term, as far as pivot at 154.13 high stays intact, expect rally to fail in the sequence of 3, 7, or 11 swing for further downside.
Litecoin (LTCUSD) 2 Hours Elliott Wave Chart
Disclaimer: Futures, options, and over the counter foreign exchange products may involve substantial risk and may not be suitable for all investors. Leverage can work against you as well as for ...
more

