
Why Ethereum Classic Could Soar 30% On A Break From This Pattern
Ethereum Classic (ETC-X) was trading about 1.5% higher on Thursday in a muted reaction to Bitcoin (BITCOMP) and Ethereum (ETH-X), which were trading up 3% and 4%, respectively.

Photo by Quantitatives.io on Unsplash
The crypto market goes through seasons where the apex cryptocurrencies, Bitcoin and Ethereum, enter into bullish cycles and after the trend reaches its peak traders and investors move their profits into the smaller alternative cryptos. This is most often referred to as “alt-season.”
The last true alt-season peaked in May 2021 when Ethereum Classic topped out at a May 6 all-time high of $175 and other alt-coin such as Dogecoin (DOGE-X) entered into a long-term bearish cycle after reaching an all-time high of $0.741 on May 8.
The money then moved from the alt-coin to the apex cryptocurrencies beginning on July 20, which eventually propelled Bitcoin and Ethereum up to Nov. 10 all-time highs of $69,000 and $4,861.81, respectively.
Since the November run to all-time highs, Bitcoin and Ethereum have declined substantially and most of the market has settled into a lull, which also happened between the beginning of May and end of July last year for a period of about 10 weeks. If history is set to repeat, this could mean another alt-season is on the horizon since it has also been about 10 weeks since the apex cryptos hit their peak.
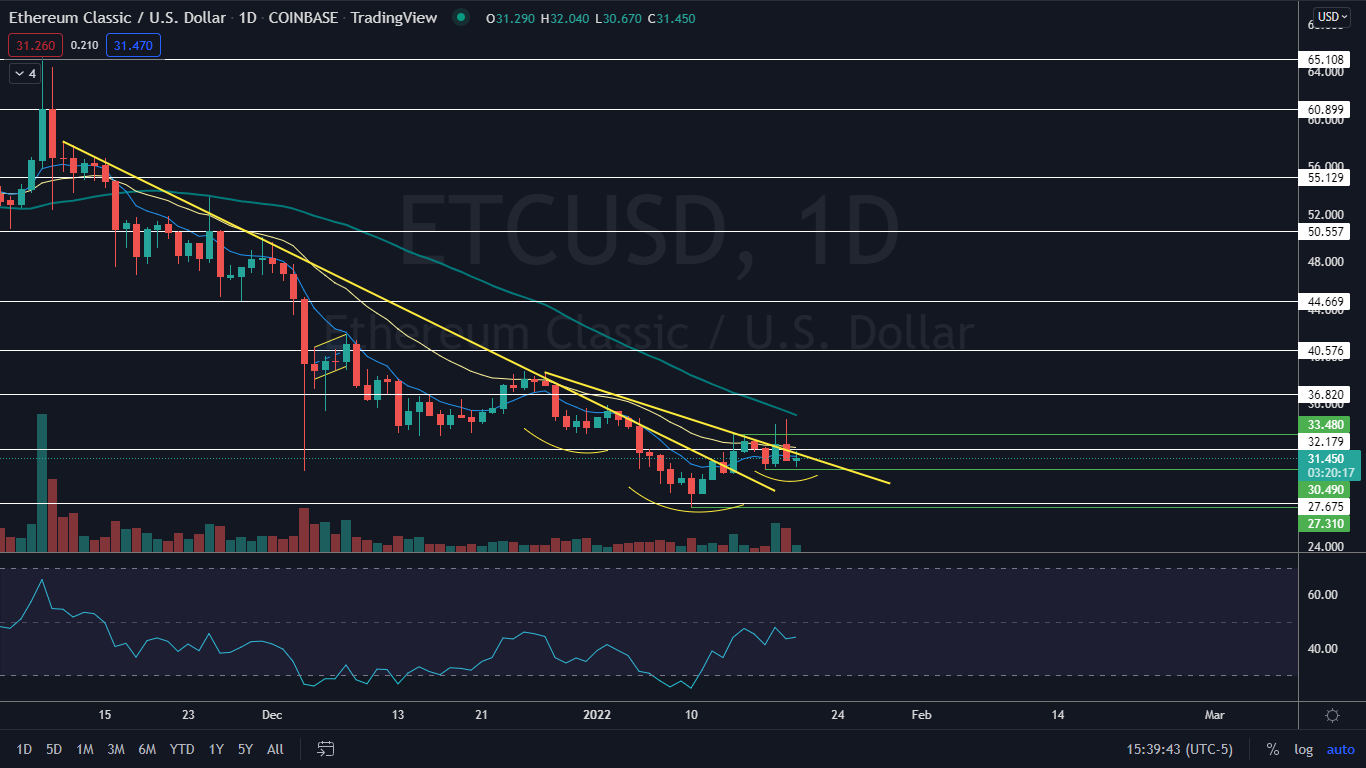
The Ethereum Classic Chart: On Jan. 14, Ethereum Classic broke up bullishly from a descending trendline that had been holding it down since Nov. 11. The break up from the trendline was made on higher-than-average volume, which indicates the pattern had been recognized.
Since then, Ethereum Classic has traded mostly sideways in consolidation, but the price action on Monday, Tuesday and Thursday this week at the $30.49 level has created a bullish quadruple bottom pattern. If the pattern is recognized, Ethereum Classic will trade higher on Friday.
Ethereum Classic also looks to be printing the right shoulder of a bullish inverted head-and-shoulder pattern, with the left shoulder printed between Dec. 27 and Jan. 4, the head formed between Jan. 5 and Jan. 14 and the right shoulder over the following days. If the pattern is recognized and the crypto breaks up bullishly from the neckline, the measured move is 30%, which implies Ethereum Classic could soar up toward the $44 mark.
Ethereum Classic is trading below the eight-day and 21-day exponential moving averages (EMAs), with the eight-day EMA trending below the 21-day, both of which are bearish indicators. The crypto is also trading below the 50-day simple moving average (SMA), which indicates longer-term sentiment is bearish.
- Bulls want to see big bullish volume come in and push Ethereum Classic up through the descending neckline of the head-and-shoulders and then for the crypto to regain support above the 50-day SMA. There is resistance above at $32.17 and $36.82.
- Bears want to see big bearish volume come in and drop Ethereum Classic down below support at $27.65, which would negate the head-and-shoulders formation. Below the level there is further support at $20.45 and $15.27.
(Click on image to enlarge)
© 2022 Benzinga.com. Benzinga does not provide investment advice. All rights reserved.


And we’re down an additional 4% since you posted!