
The entire cryptocurrency market capitalization lost almost $200 billion in value in the last 24 hours. ETH paused its recent gains as the continuation of bullish traction stalled at $3,420 on Jan. 12. Since then, the U.S dollar outperforms cryptocurrencies as risk sentiment deteriorated. Analysts are trying to find the right words to say after Ethereum’s crash and the worst week since 2020. There might be a lot of volatility in the market as we might see some dip buying on Ethereum, but more likely to see investors get rid of holdings fearing further losses. At the time of this analysis, ETH/USD is trading higher at $2,747 from its daily lows. As per data from the CoinGlass crypto analytics, a total of $101.58 in Ethereum (roughly 36,930 ETH) was liquidated across several crypto exchanges in 12 hours. The liquidations began as the price of Ethereum declined, trailing Bitcoin to its lowest level since September 2021.
Key Levels
Resistance Levels: $3,700, $3,500, $3,000
Support Levels: $2,700, $2,500, $2,300
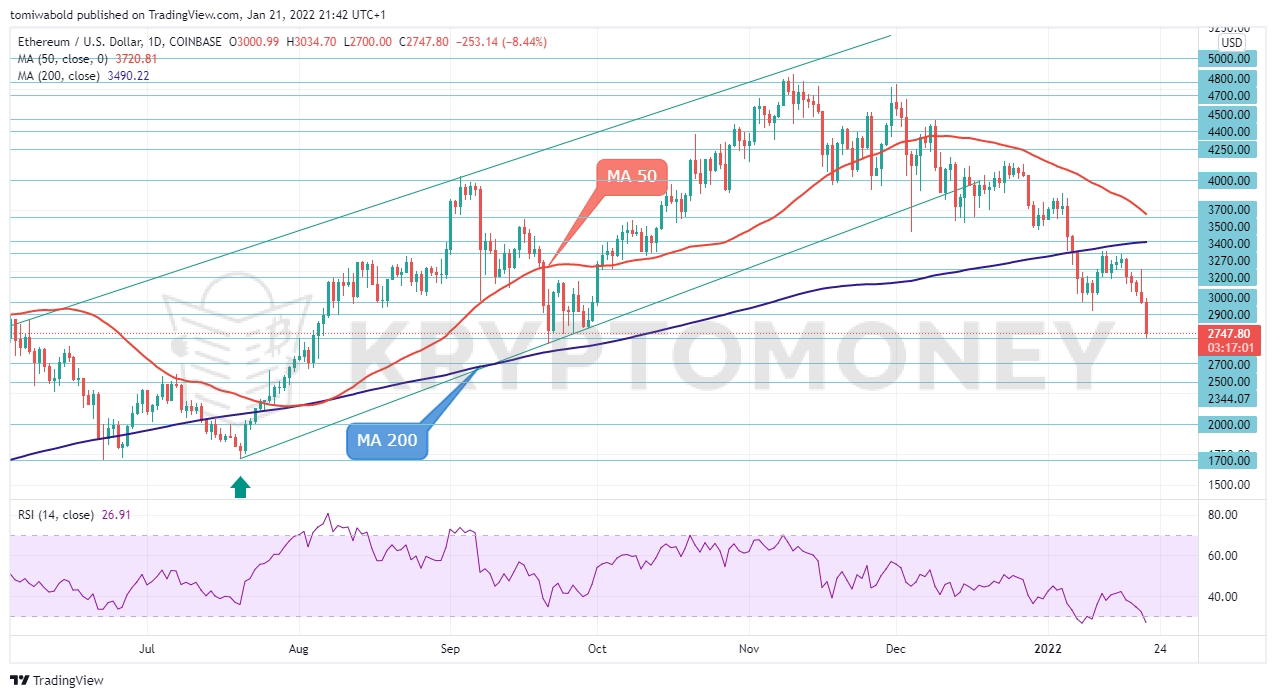 ETH/USD Daily Chart
After the initial rebound from the Jan. 10 low of $2,928, ETH/USD pair struggled to raise bids above $3,420. The breach below $3,000 psychological region forced buyers to bail out, escalating bearish sentiment. In the event of a rebound, the support zone at $3,000 now becomes a new zone of resistance.
As seen on the daily chart, a bearish forming moving average (MA 50) is set to cross the moving average (MA 200) soon, suggesting the downward acceleration might lead to a death cross. The pair is heading towards lows at the $2,700 support zone of September 2020. A rebound could occur due to an oversold relative strength index (RSI).
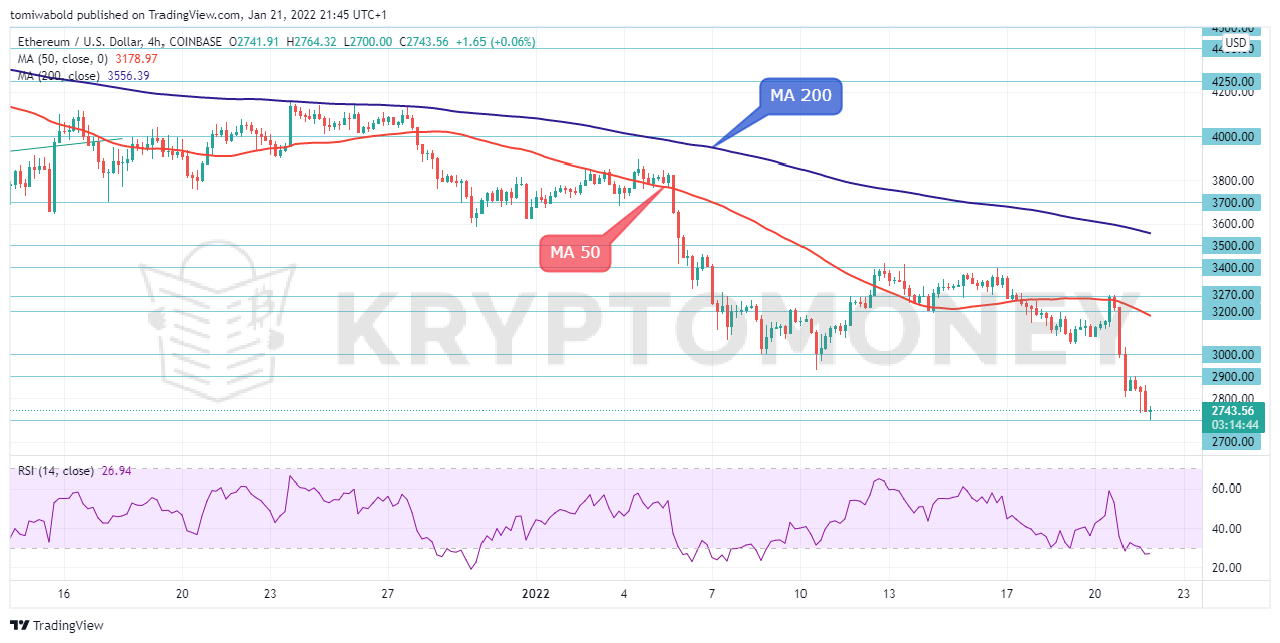 ETH/USD 4-Hour Chart
At the 4-hours chart, the relative strength index is in an oversold situation and might spark some interest in buying. However, ETH/USD expected rebound might provide trend-followers with opportunities to sell into strength. Below $3,000, ETH/USD stays bearish, trading under the moving average (MA 50).
If the bulls want another shot, they must break through initial resistance at $2,900. A loss below $2,700 on the downside would prompt a new round of selling below the September support level of $2,650. If there is a downside break, the pair could continue to move down towards the $2,500 level.
Note: Kryptomoney.com is not a financial advisor. Do your research before investing your funds in any financial asset or presented product or event. We are not responsible for your investing results
Image Credit: Shutterstock


Keep in mind that we may receive commissions when you click our links and make purchases. However, this does not impact our reviews and comparisons. We try our best to keep things fair and balanced, in order to help you make the best choice for you.
