Join Our Telegram channel to stay up to date on breaking news coverage
Price Downturns, Averaging $2,500 – January 22
There has been a continual falling price outlook in the ETH/USD market operations as the crypto-economic price downturns, averaging $2,500. The crypto economy’s percentage rate is around 0-16, denoting a slow-moving pace to the downside as of writing.
Price Downturns, Averaging $2,500: ETH Market
Key Levels:
Resistance levels: $2,750, $3,000, $3,250
Support levels: $2,500, $2,250, $2,000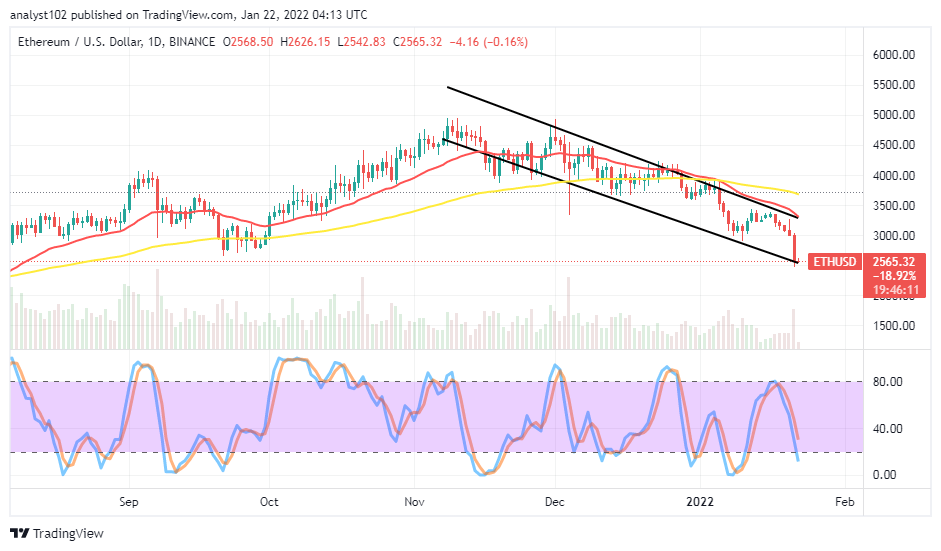 ETH/USD – Daily Chart
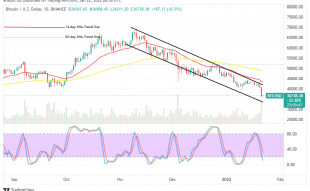
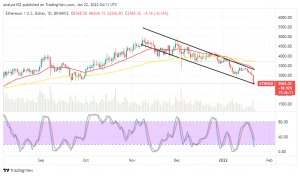
The ETH/USD daily chart shows the crypto-economic price downturns, averaging $2,500. The bearish channel trend lines have now taken a full-fledged course as the upper part is drawn closely beneath the smaller SMA to the southward side. The 50-day SMA indicator is above the 14-day SMA indicator. The Stochastic Oscillators are southbound positioned briefly into the oversold region. The current bearish trading outlook hasn’t had a significant exhaustion sign to suggest an end to the downward force presently.
Are there still reliable downward forces in the ETH/USD market as the crypto-economic price downturns, averaging $2,500?
The ETH/USD market have not witnessed a significant sign of exhaustion as the crypto-economic price downturns, averaging $2,500. It would take long-position takers some time of being patient to get a decent rebounding motion around the value line. A long-hold of positions around the same point mentioned earlier can lead to the emergence of convergences afterward. If that will have to be the situation eventually, traders will have to suspend exerting positions until a definite move features.
On the downside of the technical analysis, the ETH/USD short=position takers needed to continue to build more strengths on the present downward force beneath the resistance value line of $2,750. There may be a pit stop at $2,500 to allow the market has a respite before diving in a direction. A sudden aggressive breakdown at the value line may cause an extension of the downward trend to achieve a lower trading support point in the long run.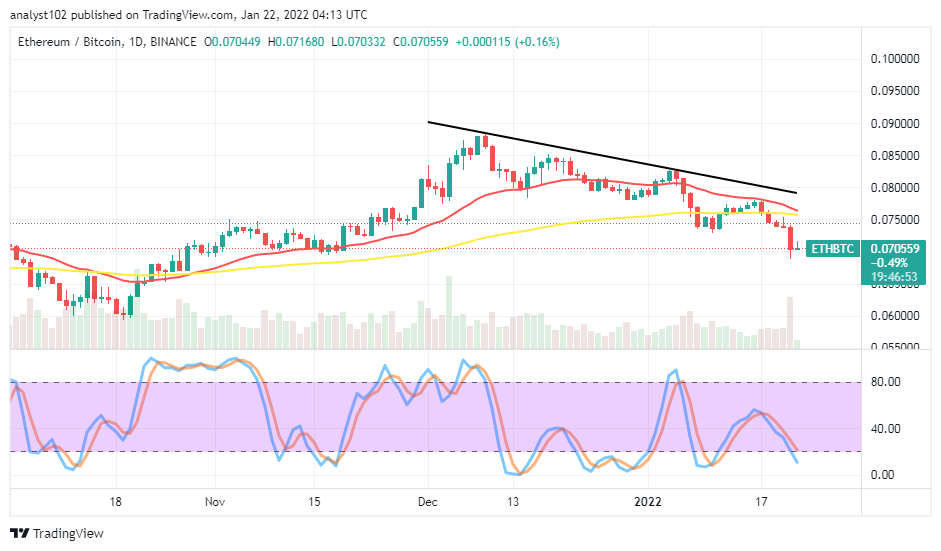
ETH/BTC Price Analysis
In comparison, Ehereum, as the base trading instrument, has been under a countering-falling force inflicted on it by Bitcoin over a couple of sessions. Alternatively, the cryptocurrency pair price downturns, averaging a lower support level underneath the trend lines of the SMAs. The Stochastic Oscillators have bent southbound into the oversold region. And they still point to the south, signaling that the downward pressure is ongoing. That showcases that ETH is yet to get over succumbing to the declining force as paired with BTC.
Looking to buy or trade Bitcoin (BTC) now? Invest at eToro!
Read more:
Join Our Telegram channel to stay up to date on breaking news coverage