
Bitcoin, VIX, And Expected Inflation
Bitcoin’s lost half its value since its recent peak. Could one explain this to one’s students, quantitatively? First take a look at the correlation with the most commonly discussed factor in the recent episode – risk.

Figure 1: Coinbase bitcoin (blue, left log scale), and VIX (brown, right scale). Source: Coinbase, and CBOE via FRED.
There is some apparent negative correlation between risk, as proxied by the VIX, and the price of bitcoin. However, there’s a big trend in bitcoin (even when logged), so estimating in first differences might be more appropriate at capturing a relationship. One finds for 1/14/2015-1/21/2022:
Δlogbitcoint = 0.0001 – 0.006ΔVIXt – 7.310 Δπet + ut
Adj-R2 = 0.04, SER = 0.048, DW = 2.45, N = 1371. bold face denotes significance at 10% msl using HAC robust standard errors.
Where πe is expected 5 year inflation from TIPS breakeven, in decimal. Interestingly, neither expected inflation, nor real interest rate (TIPS 5 year) are significant. However, even the identified relationship with the VIX doesn’t look particularly strong. If one looks for breaks using a Bai-Perron structural break test, a break is identified at 3/12/2020. Inspecting Figure 1, one sees this is just before the spike in the VIX.
In Figure 2, I show the data from 3/1/2020 through 1/22/2022.
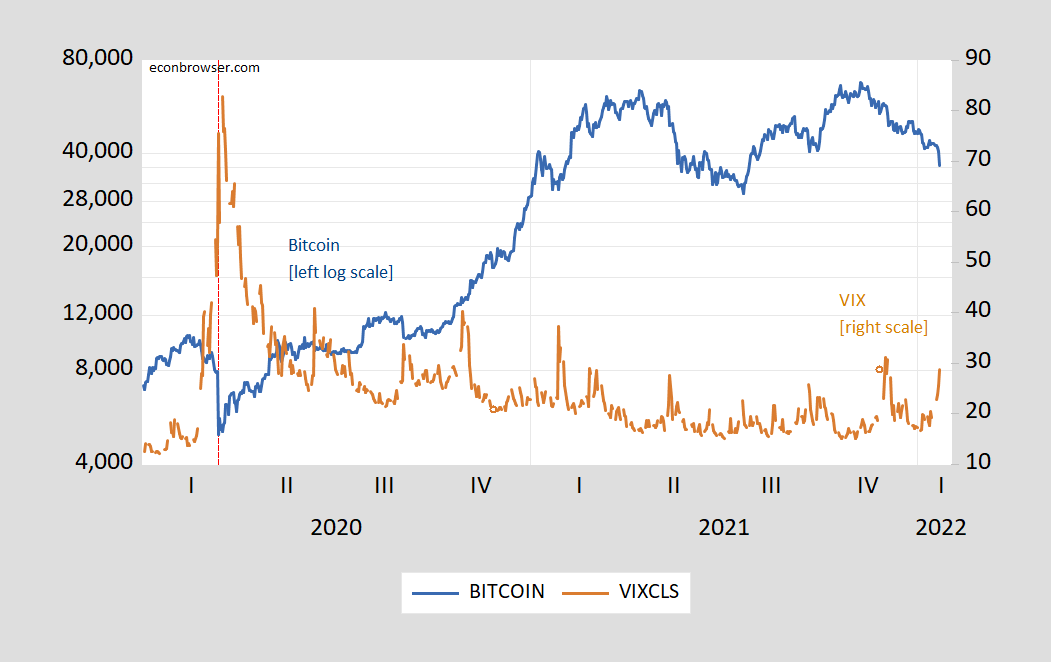
Figure 2: Coinbase bitcoin (blue, left log scale), and VIX (brown, right scale). Red dashed line at 3/12/2020. Source: Coinbase, and CBOE via FRED.
Over the subsample identified by the Bai-Perron procedure (3/12/2020-1/21/2022), the regression yields:
Δlogbitcoint = 0.0001 – 0.010ΔVIXt – 3.559 Δπet + ut
Adj-R2 = 0.27, SER = 0.041, DW = 2.13, N = 365. bold face denotes significance at 10% msl using HAC robust standard errors.
So, yes, it looks like changes in bitcoin prices — particularly right now — are being driven by risk appetite as proxied by the VIX: over the past month, about 42% of the variation.
Little estimated sensitivity to inflation expectations suggests bitcoin is not a good hedge against inflation; statistically significant correlation with the S&P 500 suggests it’s not a good hedge for stocks.
For more speculation on what drives bitcoin prices particularly over longer horizons, see here.
Update, 5;15pm Pacific:
Reader Joseph points out that political/regulatory events matter too, and I agree. Here’s a graph I generated for my students in the Fall.
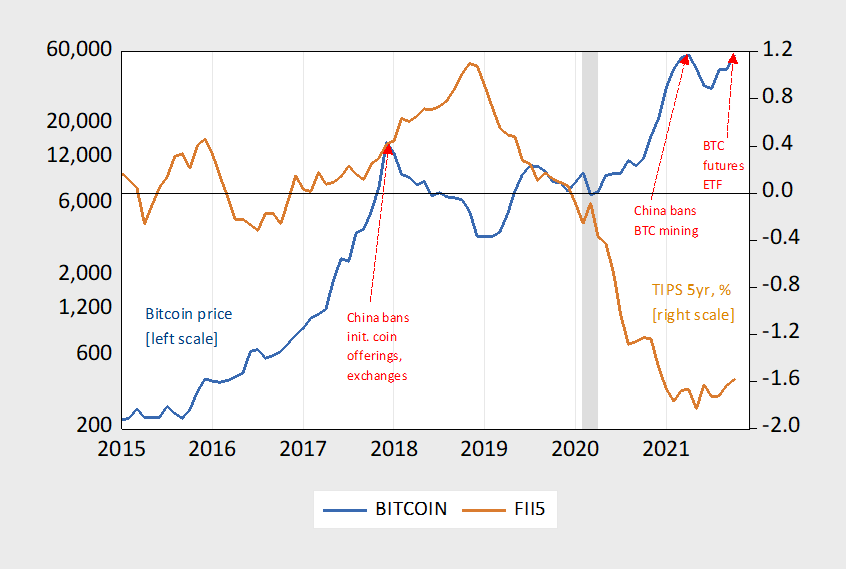
Figure 3: Bitcoin (blue, left log scale), and TIPS 5 year yield, % (brown). NBER defined recession dates shaded gray. Source: Coinbase and Federal Reserve via FRED, NBER.
Disclosure: None.


