XRP fell in tandem with the rest of the crypto market in the prior week. Prices had a mild reprieve on Jan. 24 only for bears to return, dragging XRP price to intraday lows of $0.55. XRP is currently attempting a rebound as the RSI hints at it being oversold. At the time of publication, XRP traded at $0.599, down 1.54% in the last 24 hours as per CoinMarketCap data. In a recent update posted by Attorney James K. Filan of Filan LLC on the Ripple-SEC lawsuit. Ripple defendants have filed an objection to the SEC’s request for additional time to file a motion for reconsideration of Judge Netburn’s DPP ruling. In a Jan. 13 ruling, SEC was asked to turn over the documents including the draft of former Director Hinman’s 2018 speech. The SEC had asserted that these documents were protected by the deliberative process privilege (DPP). SEC had filed a motion requesting for an extension of the date for submission until Feb. 17.
Key Levels
Resistance Levels: $0.8200, $0.7500, $0.6950
Support Levels: $0.5141, $0.4799, $0.4000
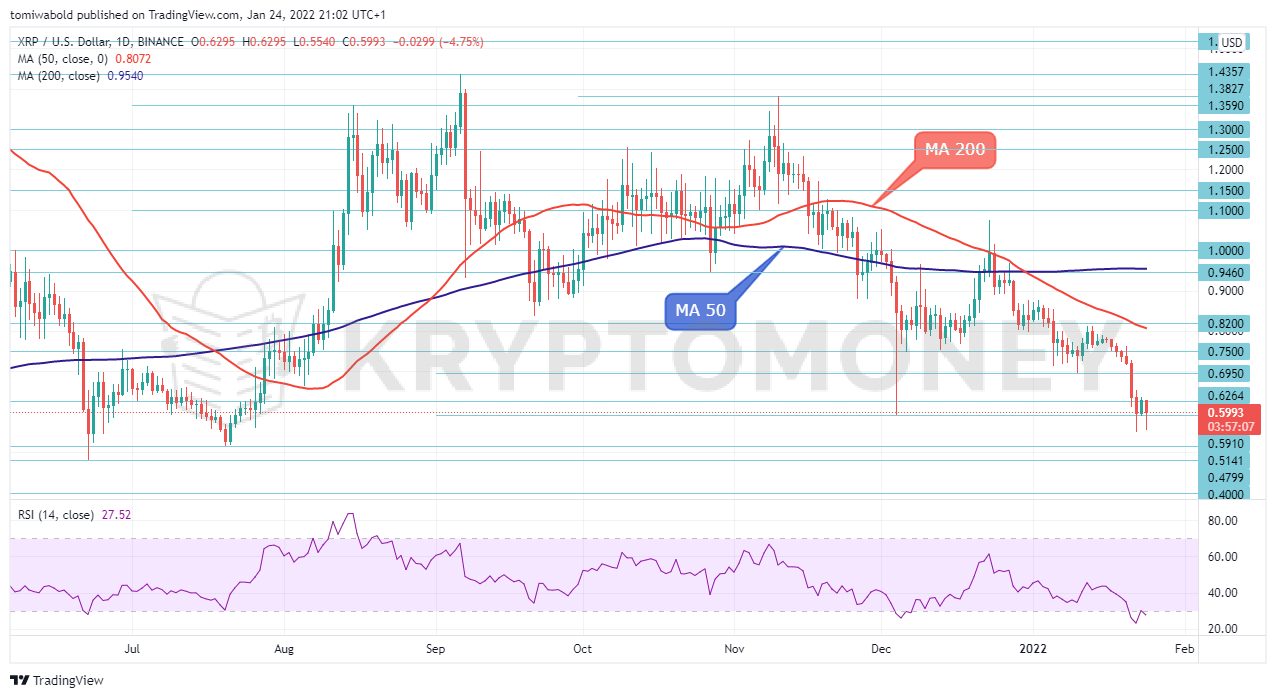 XRP/USD Daily Chart
XRP has been in a free-fall over the last couple of days, recording fresh lows of $0.554 on Jan. 24. The daily RSI momentum indicator is attempting to rise out of the oversold territory, suggesting that the market could retrace in the near term or consolidate recent losses.
If the RSI changes direction and moves higher from oversold levels at 30, then XRP/USD could pick up momentum and rise. Should the bulls take over, immediate resistance could develop within the MA 50 to MA 200 at $0.80-$0.95 levels respectively. On the other hand, additional declines may drive the price towards recent lows of $0.554 before slipping to the $0.51 key level.
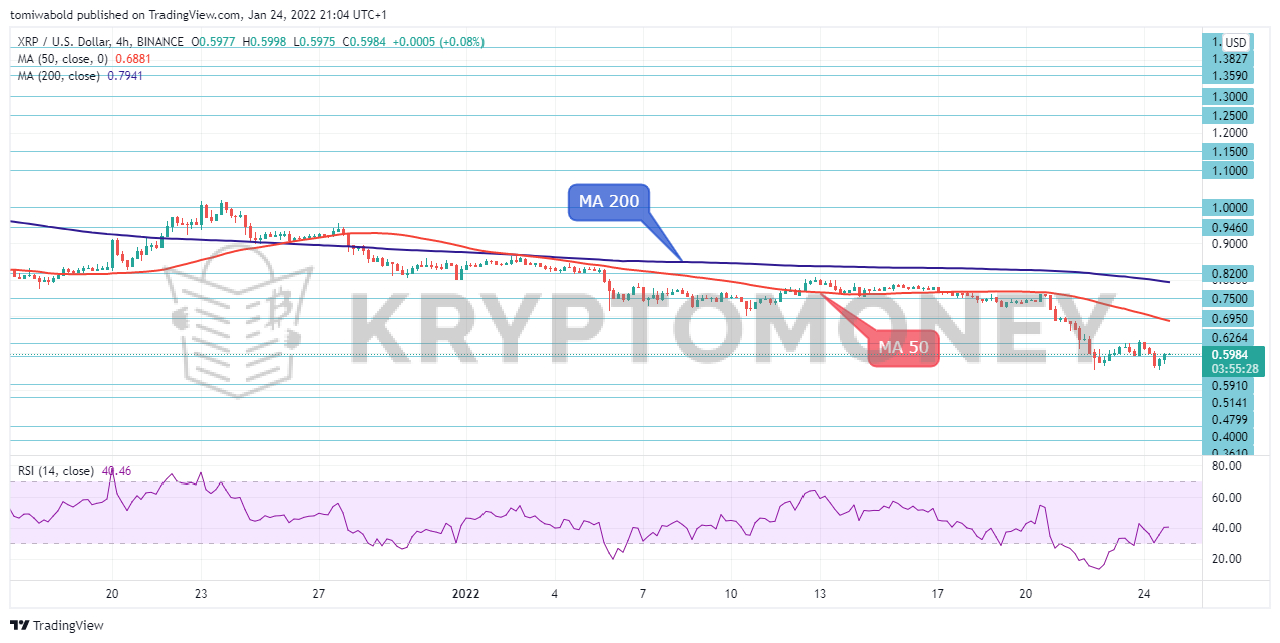 XRP/USD 4-Hour Chart
XRP has been in a sell-off mode since late December. A rebound, or at least a sideways trading, cannot be ruled out in the short term as the price hits a double bottom from lows around $0.554. If the pair continues the recent rebound from the recently set lows, XRP could reach the $0.65 level.
Crawling higher, the price may attempt to cross above the MA 50 and 200 at $0.69 and $0.79 respectively. Further price advances might lead to a rise to the $1 range. In the negative scenario, XRP could retest the $0.554 support.
Image Credit: Shutterstock


Keep in mind that we may receive commissions when you click our links and make purchases. However, this does not impact our reviews and comparisons. We try our best to keep things fair and balanced, in order to help you make the best choice for you.