
Two Trades To Watch: Gold, USD/CAD - Wednesday, Jan. 26
Gold below $1850 ahead of the Fed. USDCAD falls ahead of the BoC.

Gold trades below $1850 ahead of the Fed
Gold is holding steady on Wednesday after booking mild gains across the week. The precious metal has been caught up in mixed market sentiment.
Eastern Europe political tensions are acting as a support to the price of gold. Fresh developments pointing to an invasion by Russia imto Ukraine could lift the precious metal higher.
Meanwhile the prospect of a more hawkish Fed has been capping gains keeping Gold below the psychological level of $1850.
No rate hike is expected from the Fed. However, should the Fed bring a hawkish surprise regarding the reduction of the balance sheet gold could correct lower.
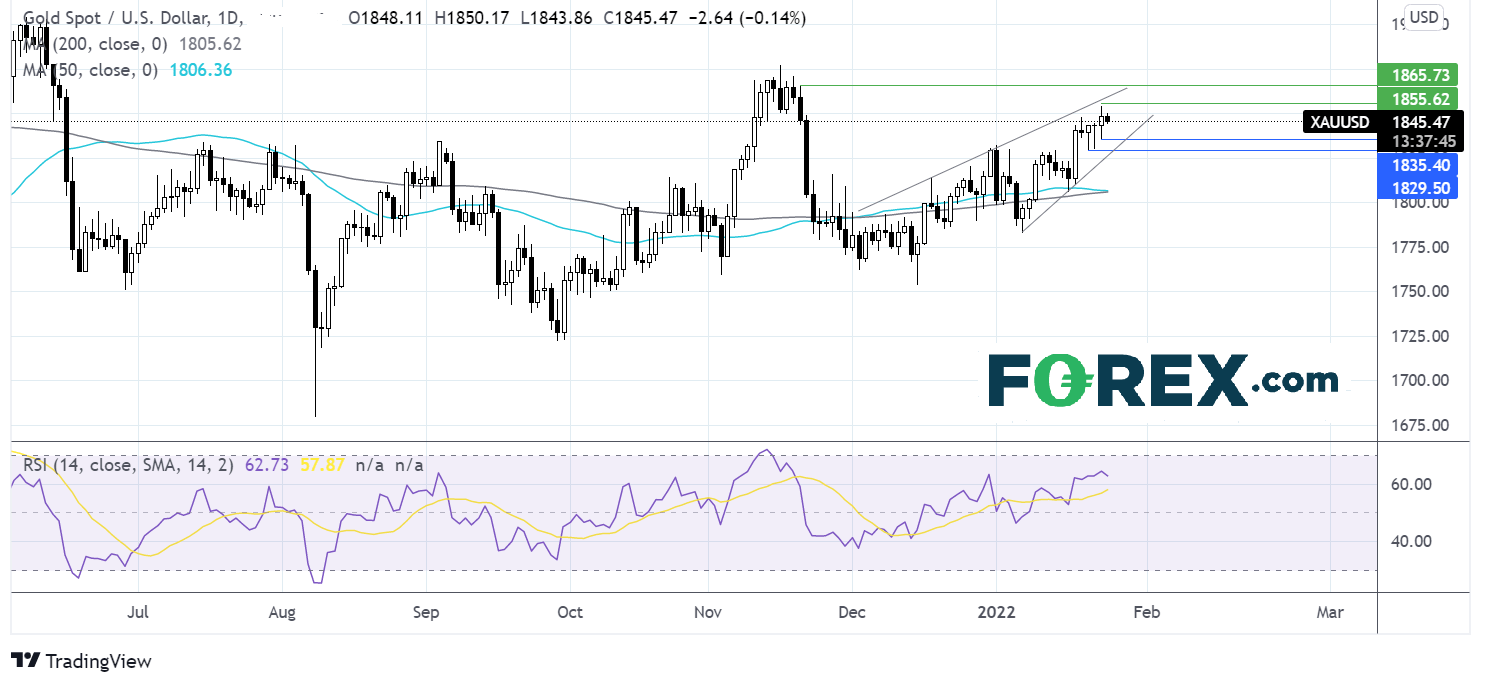
Where next for gold prices?
Gold trades with a rising wedge with the upside resistance at $1853. Failure to push above this level could see the price could see the price fall back towards yesterday’s low of $1835 ahead of $1829 Friday’s low.
The 50 sma is crossing below the 200 sma in a death cross formation, a bearish signal.
Should the Fed sound less hawkish than expected Gold could push higher above $1853 towards $1864 the November 19 high.
USD/CAD falls ahead of BoC interest rate
The BoC is due to announce its interest rate decision today. Whilst the central bank has guided for a rate hike later in 2022.
However, given the strength of the Canadian economic recovery, the low unemployment rate and surging inflation, the BoC could bring a hawkish surprise and give the green light to start hiking rates.
Markets are pricing in a 70% probability of a 25-basis point rate hike in the January. As a result, the CAD could jump on a BoC decision to hike pushing USD/CAD towards 1.25 (Fed dependent).
Where next for USD/CAD?
The recent bounce from the 200 sma at 1.25 saw USD/CAD run higher into resistance at the 50 sma at 1.27. A move below 1.26 yesterday’s low has opened the door to 1.2580, the mid-January high, before the 200 sma at 1.25. The RSI is supportive of further downside.
On the flip side, 1.2665 yesterday’s high could act as resistance ahead of a retest of the 50 sma at 1.27 and towards 1.2810 the 6 January high.


