Join Our Telegram channel to stay up to date on breaking news coverage
Litecoin Price Relaxes Closely Above $100 – January 26
Currently, it appears that the LTC/USD market has been less active in motions over a couple of sessions as the crypto-economic price relaxes closely above $100. The market’s current percentage is rated at 1.50 positives, trading between the high of $110 and $106 lines as of writing.
Price Relaxes Closely Above $100: LTC Trade
Key Levels:
Resistance levels: $125, $145, $165
Support levels:$100, $80,$60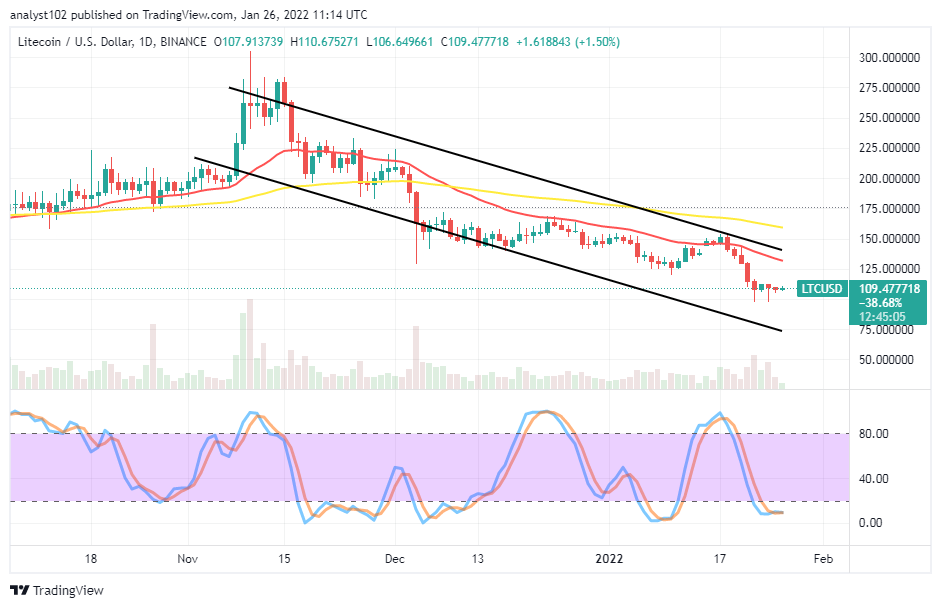
LTC/USD – Daily Chart
The LTC/USD daily chart showcases the crypto-economic price relaxes closely above $100 as variant smaller candlesticks have been emerging in a continual process, giving a confirmation outcome of that situation. The 50-day SMA trend line is above the 14-day SMA trend line. The bearish channel trend lines drew to keep the pushing pace that price has been maintaining in its pushes. The Stochastic Oscillators are in the oversold region clogged to indicate an ongoing pause-trading condition.
Will there be no change of trading conditions in the LTC/USD market as the crypto-economic price relaxes closely above $100?
There may be a relatively gathering of upward momentums on a slow-and-steady moving mode probably be featuring in sequential order in the subsequent operations of the LTC/USD market as the crypto-economic price relaxes closely above the $100 level. A set of variant candlesticks, carrying bottom-shadow shapes, has begun to feature near above the value line. And that signifies a signal confirmation of seeing the upward momentums being garnering. However, it may not be too safe that long-position takers jump in at no point in time, trying to ride alongside the presumed situation.
On the downside of the technical analysis, the LTC/USD market short-position takers are to stay off the market for a while to let the price muster up some energy before launching a sell order. The resistance level at $150 seems to be the first main point for the price rejections zone and, it could extend to the $175 level before getting the decent entries for the bearish trend returning afterward.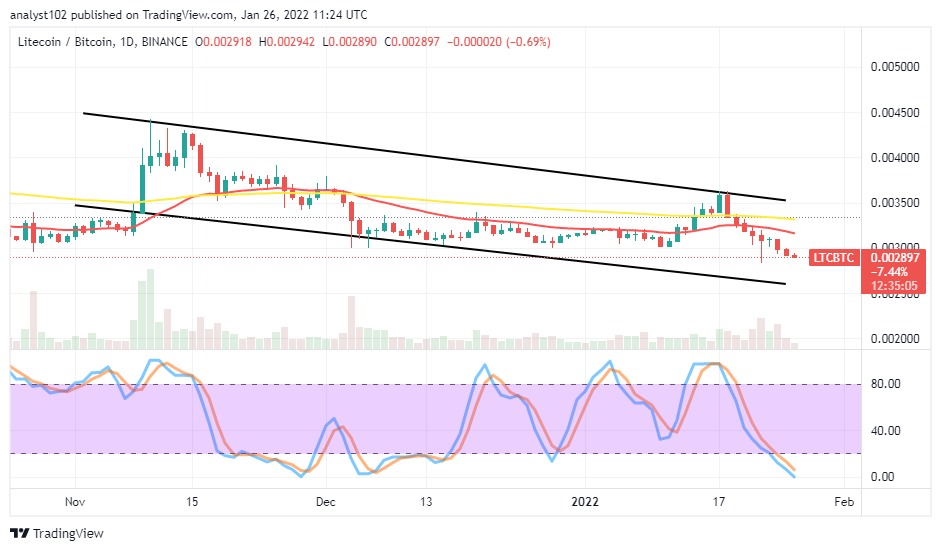
LTC/BTC Price Analysis
In comparison, Litecoin, on the price analysis chart, remains to succumb to depressions as placed with Bitcoin. The cryptocurrency pair price still moves toward the lower bearish trend line underneath the SMA trend lines. The 14-day SMA indicator is beneath the 50-day SMA indicator. The Stochastic Oscillators are in the oversold region, slightly bending toward the south within it at the range of zero. That signifies the base crypto may soon be finding a stance to push against the counter crypto in no time.
Looking to buy or trade Bitcoin (BTC) now? Invest at eToro!
68% of retail investor accounts lose money when trading CFDs with this provider.
Read more:
Join Our Telegram channel to stay up to date on breaking news coverage