Join Our Telegram channel to stay up to date on breaking news coverage
Bitcoin Price Prediction – January 26
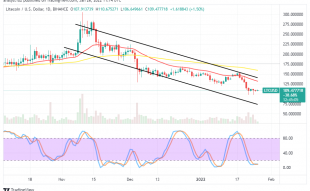
The Bitcoin price prediction reveals that BTC moves close to the resistance level of $39,000 level as it is now rising towards the north.
BTC/USD Long-term Trend: Bearish (Daily Chart)
Key levels:
Resistance Levels: $44,000, $46,000, $48,000
Support Levels: $33,000, $31,000, $29,000
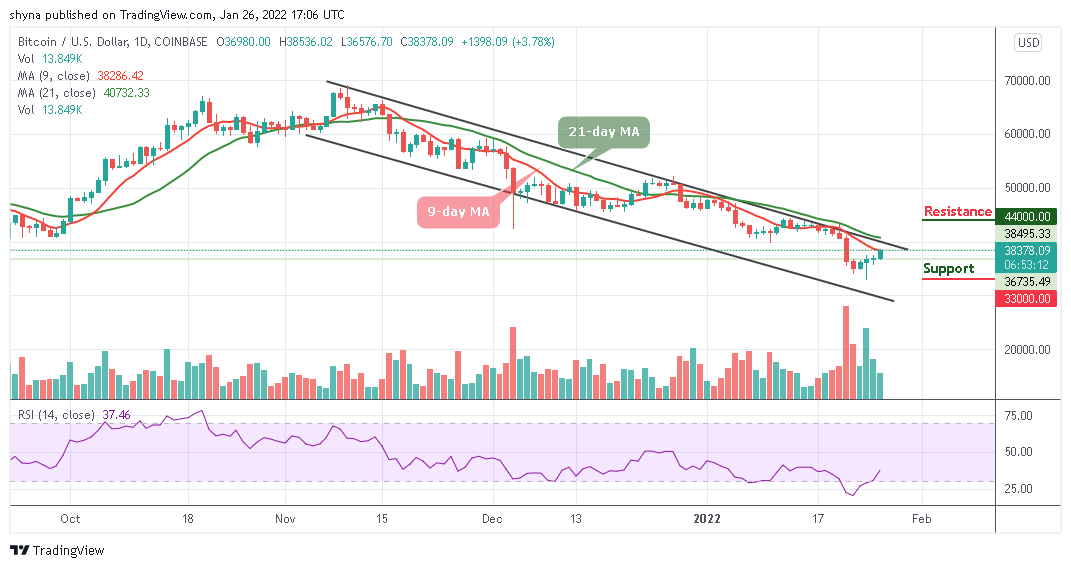
BTC/USD is currently recovering higher from the opening price of $36,980 level and the first digital asset may need to cross above the 9-day moving average to continue to the bullish movement. As of the time of this writing, the Bitcoin price still sits above $38,000 as a near $40,000 peak was seen with this recent rally during the European session today but currently moving upward as the market prepares for additional bullish move
Bitcoin Price Prediction: Would BTC Gain More?
According to the daily chart, traders could see that the Bitcoin price converges above the key level of $38,000. The 9-day MA trend-line is likely to cross above the 21-day MA as they prepare to create more upsides. The technical indicator Relative Strength Index (14) moves toward 40-level to probably cross into the positive side. However, the first major resistance to locate is near the $39,000 level while the main resistance is still near the $40,000 level.
Moreover, a clear break above the $38,000 level could set the pace for a larger increase to $44,000, $46,000, and $48,000 resistance levels. Meanwhile, should the Bitcoin price fail to clear the $39,000 resistance, it could start a new decline as the initial support on the downside is near the $38,000 level. If there is a downside break below this level, the price could see a sharp decline towards the support levels of $33,000, $31,000, and $29,000 respectively.
BTC/USD Medium – Term Trend: Bearish (4H Chart)
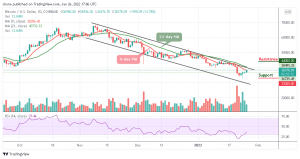
According to the 4-hour chart, BTC/USD looks bullish as the market continues to show a sign of a bullish trend since the daily opening. However, the intraday trading is still looking bullish; following the recent rebound at $38,000 which is now a key support level. Meanwhile, any bearish movement below the 9-day and 21-day moving averages could locate critical support at $35,000 and below.
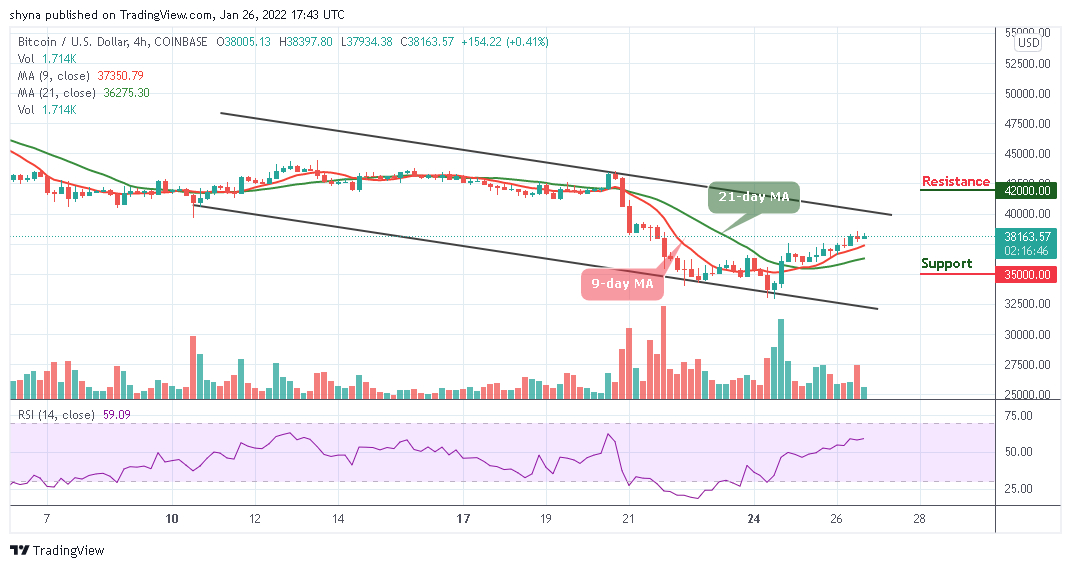
However, considering the recent sharp rebound, the Bitcoin price may continue the bullish rally to $40,000 resistance. A climb above the upper boundary of the channel may further push the BTC price to the resistance level of $42,000 and above. As it is, the bears may likely return to the market as the Relative Strength Index (14) remains below 60-level, suggesting either a sideways movement or bearish movement.
Looking to buy or trade Bitcoin (BTC) now? Invest at eToro!
68% of retail investor accounts lose money when trading CFDs with this provider
Read more:
Join Our Telegram channel to stay up to date on breaking news coverage