
Gold Is Bruised But Can Show Strength – By Doing Nothing
The Fed finally said it: the rates are going up. The USD Index and gold heard it and reacted. The former is at new yearly highs, while gold slides.
The medium-term outlook for gold is now extremely bearish.
The above might sound like a gloom and doom scenario for precious metals investors, but I view it as particularly favorable. Why? Because:
- This situation allows us to profit from the upcoming decline in the precious metals sector through trading capital.
- This situation allows us to detect a great buying entry point in the future. When gold has everything against it and then it manages to remain strong – it will be exactly the moment to buy it. To be more precise: to buy into the precious metals sector (I plan to focus on purchasing mining stocks first as they tend to be strongest during initial parts of major rallies). At that moment PMs will be strong and the situation will be so bad that it can only improve from there – thus contributing to higher PM prices in the following months.
- Most market participants have not realized the above. “Gold and (especially) silver can only go higher!” is still a common narrative on various forums.
Having said that, let’s take a look at the short-term charts.
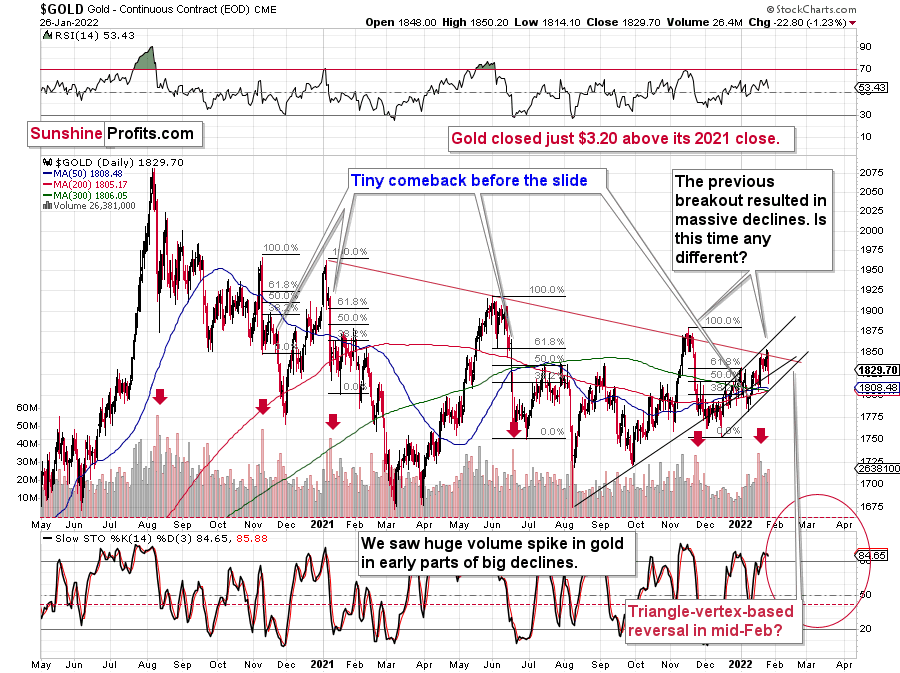
In short, gold declined significantly, and it’s now trading once again below the rising support/resistance line, the declining red resistance line, and back below the 2021 closing price (taking also today’s pre-market decline into account).
In other words:
- All important short-term breakouts were just invalidated.
- 2022 is once again a down year for gold.
Is this as bearish as it gets for gold? Well, there could be some extra bearish things that could happen, but it’s already very, very bearish right now.
For example, gold market could catch up with its reactions to USD Index’s strength.
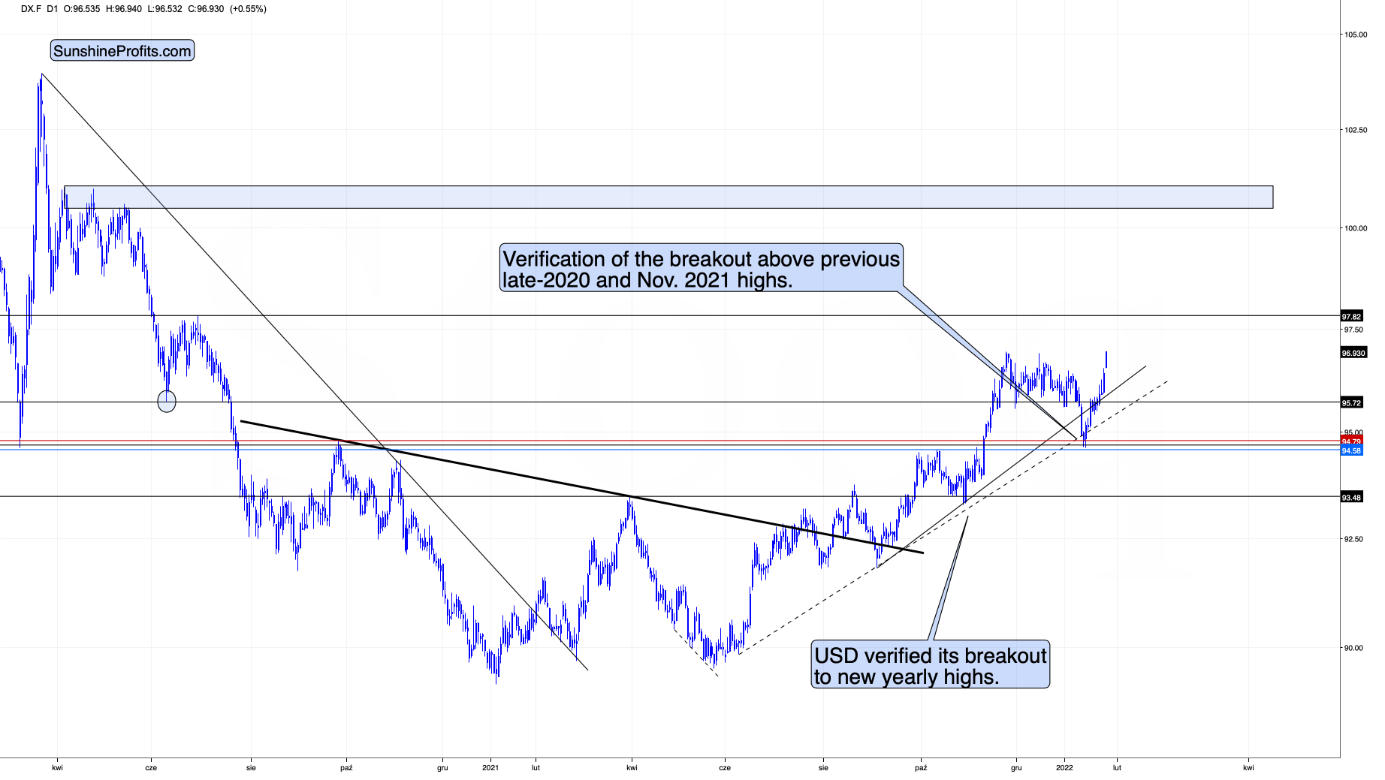
The U.S. currency just moved above its previous 2022 and 2021 highs, while gold is not at its 2021 lows.
Yet.
I wouldn’t view gold’s performance as true strength against the USD Index at this time just yet. Why? Because of the huge consolidation that gold has been trading in.
The strength that I want to see in gold is its ability not to fall or soar back up despite everything thrown against it, not because it’s stuck in a trading range.
In analogy, you’ve probably seen someone, who’s able to hold their ground, and not give up despite the world throwing every harm and obstacle at them. They show their character. They show their strength. Inaction could represent greater wisdom and/or love and focus on one’s goal that was associated with the lack of action. You probably know someone like that. You might be someone like that.
The above “inaction” is very different from “inaction” resulting from someone not knowing what to do, not having enough energy or willpower.
Since markets are ultimately created by people (or algorithms that were… ultimately still created by people) is it any surprise that markets tend to work in the same way? One inaction doesn’t equal another inaction, and – as always – context matters.
However, wasn’t gold strong against the USD Index’s strength in 2021?
It was, but it was very weak compared to the ridiculous amounts of money that were printed in 2020 and 2021 and given the global pandemic. These are the circumstances, where gold “should be” soaring well above its 2011 highs, not invalidating the breakout above it. The latter, not the former, happened. Besides, the “strength” was present practically only in gold. Silver and miners remain well below their 2011 highs – they are not even close to them and didn’t move close to them at any point in 2020 or 2021.
Gold has been consolidating for many months now, just like it’s been the case between 2011 and 2013.
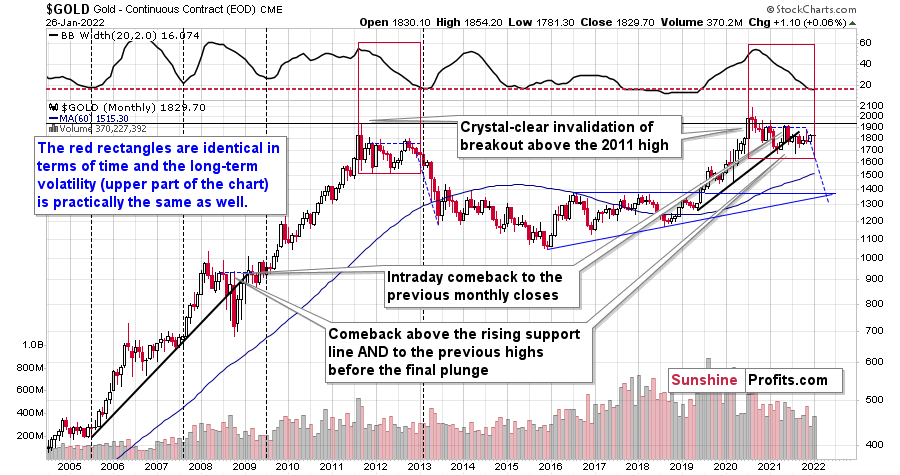
The upper part of the above chart features the width of the Bollinger Bands – I didn’t mark them on the chart to keep it clear, but the important detail is that whenever their width gets very low, it means that the volatility has been very low in the previous months and that it’s about to change.
I marked those cases with vertical dashed lines when the big declines in the indicator took it to or close to the horizontal, red, dashed line. In particular, the 2011-2013 decline is similar to the current situation.
What does it mean? It means that gold wasn’t really showing strength – it was stuck. Just like 2012 wasn’t a pause before a bigger rally, the 2021 performance of gold shouldn’t be viewed as such.
What happened yesterday showed that gold can and will likely react to hawkish comments from the Fed, that the USD Index is likely to rally and so are the interest rates. The outlook for gold in the medium term is not bullish, but very bearish.
The above is a positive for practically everyone interested in the precious metals market (except for those who sell at the bottom that is), as it will allow one to add to their positions (or start building them) at much lower prices. And some will likely (I can’t guarantee any performance, of course) gain small (or not so small) fortunes by being positioned to take advantage of the upcoming slide.
Disclaimer: All essays, research and information found on the Website represent the analyses and opinions of Mr. Radomski and Sunshine Profits' associates only. As such, it may prove wrong ...
more

