Join Our Telegram channel to stay up to date on breaking news coverage
Litecoin Price Prediction – January 27
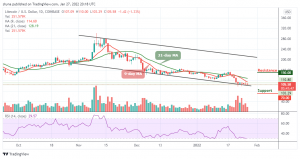
The Litecoin price prediction is bearish as the market has been consolidating for the past few hours below the moving averages.
LTC/USD Market
Key Levels:
Resistance levels: $150, $160, $170
Support levels: $70, $60, $50
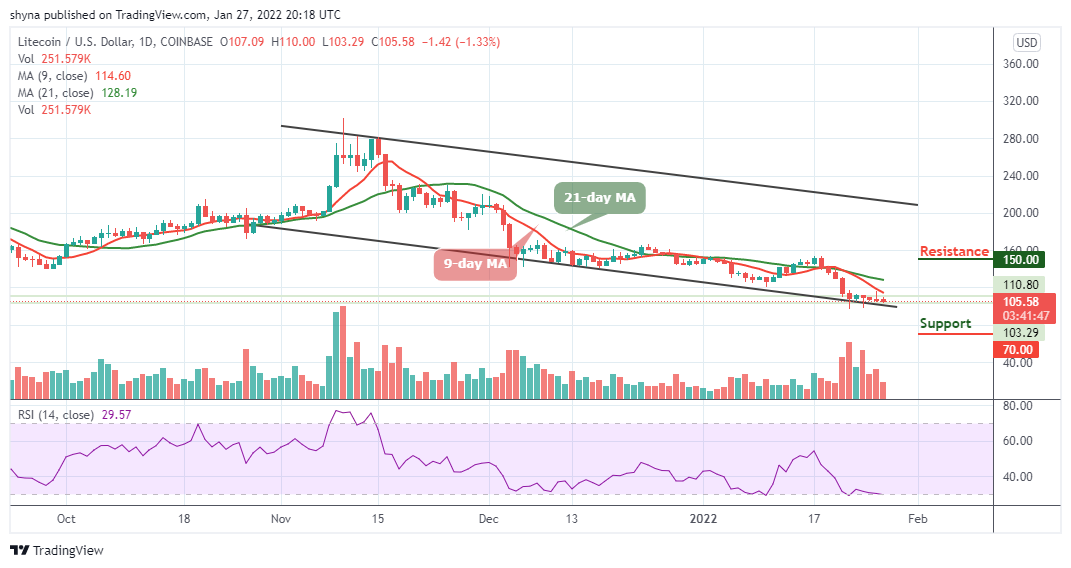
At the time of writing, LTC/USD is trading down around 1.64% at its current price of $105.58; the coin is down slightly from its opening price at $107.09. Meanwhile, while zooming out and looking at Litecoin’s price action for the past few day’s trading periods, it is clear how much volatility it has been incurring, as it is now, the price is trading below the 9-day and 21-day moving averages.
Litecoin Price Prediction: Litecoin (LTC) May Remain at the Downside
Looking at the daily chart, the Litecoin price is seen consolidating around the lower boundary of the channel. From above, the nearest resistance level lies above the 9-day and 21-day moving average. Therefore, if the buyers can climb above this barrier, further resistance levels may be located at $150, $160, and $170. On the other hand, if the market price crosses below the lower boundary of the channel, it may likely hit the nearest support at $80.
In addition, if the sellers continue to push the price under the lower boundary of the channel, then, the $70, $60, and $50 support levels could be touched. Now, the technical indicator Relative Strength Index (14) is likely to move into the oversold region, suggesting more bearish signals into the market.
Comparing with BTC, the Litecoin price is presently below the 9-day and 21-day moving averages. Looking at the daily chart, the 9-day MA is crossing below the 21-day MA within the channel. The daily chart also reveals that the market remains at the downside.
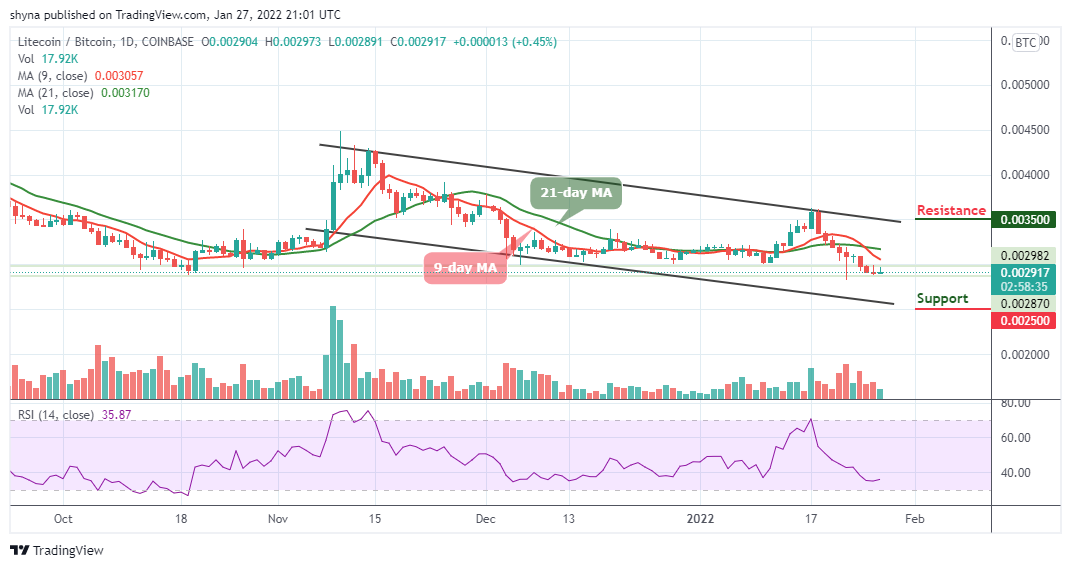
However, if the price moves toward the lower boundary of the channel, the nearest key support lie at 2600 SAT, but further support could be found at 2500 SAT and below in a subsequent move. Similarly, an upward movement above the moving averages may likely find immediate resistance at 3400 SAT, If the bulls climb above the upper boundary of the channel, higher resistance lies at 3500 SAT and above. Meanwhile, the technical indicator Relative Strength Index (14) moves below 40-level.
Looking to buy or trade Litecoin (LTC) now? Invest at eToro!
68% of retail investor accounts lose money when trading CFDs with this provider
Join Our Telegram channel to stay up to date on breaking news coverage