
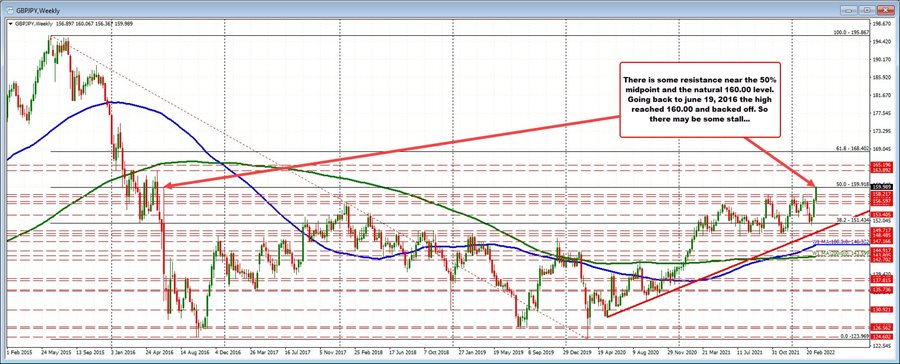
The GBPJPY is running running higher and in the process is up testing the 50% midpoint of the longer term range from the 2015 high down to the 2020 low (the 2020 low was near the swing low from 2016). The point level comes in at 159.918. The price highs breaking above that level now and is trading right near the natural level 160.00. The high price going back to June 19, 2016 reached 160.09. As I type the price is now trading above the 160.09 level to a high of 160.15. This thing can run more. It would now take a move back below the 159.91 level to start to hurt the intraday move, but that is just step one now.
Looking back to 2016, the price traded above and below the 160.00 from mid-March to near mid-June. The high during that period reached 163.89 which is a target on more upside. The low was at 151.43 (which is also near the 38.2% on the weekly chart above).
The price a few weeks ago fell below the lower swing level to 150.96, but after a few days of trading above and below the level, the price based and started its sharp trend move to the upside (see hourly chart below).

The close risk is now the 50% midpoint. Below that it would take a move below the rising 100 bar MA on the 5 minute chart below (blue line. That is rising toward the 38.2% of the trend move higher today.
More recently there has been come stall and ups and downs as the pair approached 160.00 level, but the pair's declines were still modest relatively, to the run higher. Getting below the 38.2-50% area and the rising 100 bar MA at 159.10 currently is required to take the pair out of the trend like mood it is in now.


