

Monero (XMR) has broken out from a diagonal resistance level but has yet to reclaim an important long-term resistance.
XMR has been moving upward since reaching a low of $132.1 on Feb 24. On March 28, this upward movement led to a breakout from a descending resistance line, which had previously been in place since Aug 24.
So far, XMR reached a high of $272 on April 12, discounting the long upper wick (red icon) of March 8.
Currently, the price is attempting to move above the 0.618 Fib retracement resistance level at $260. If it is successful in doing so, the next resistance would be at $290.

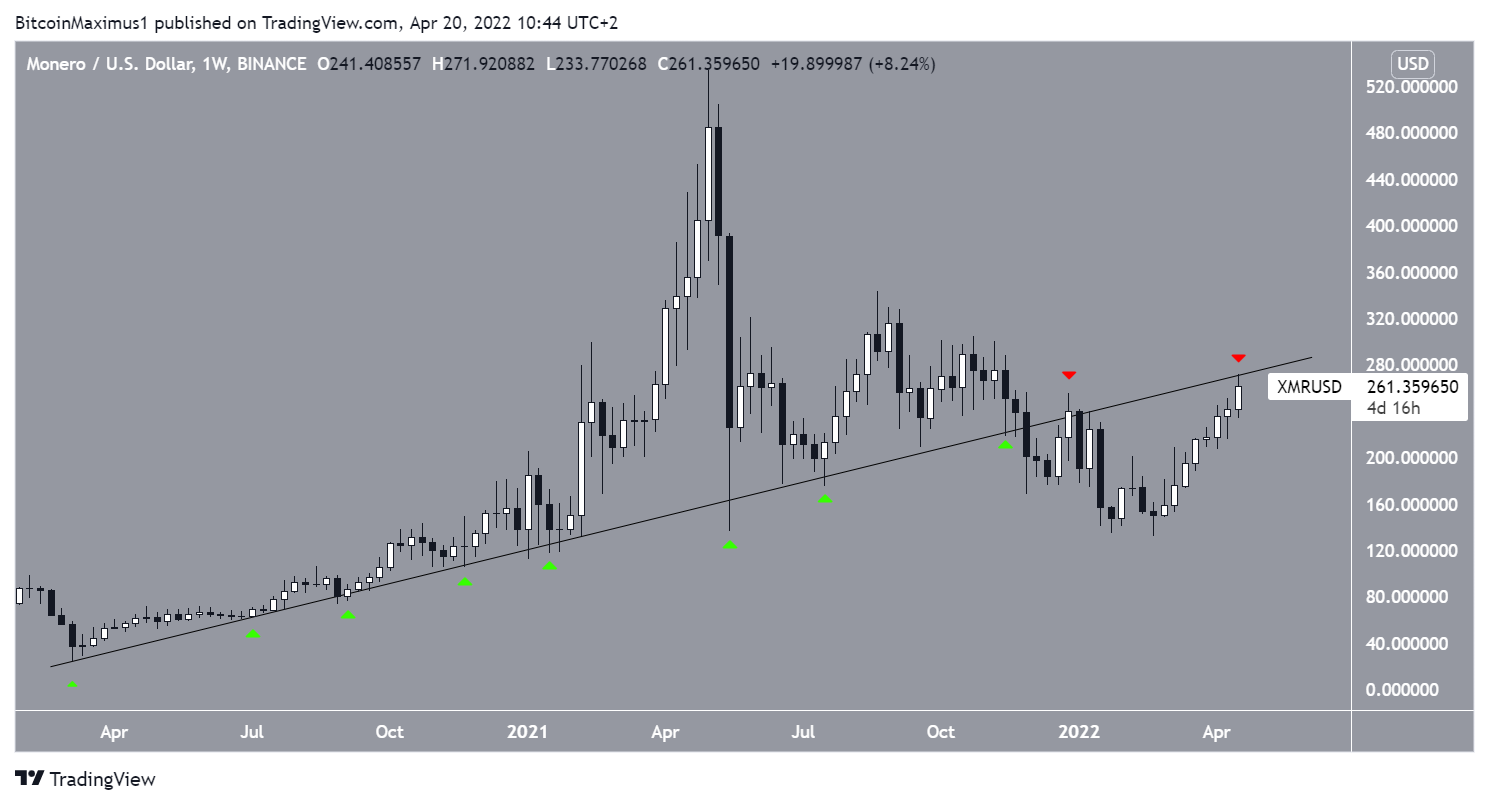
Despite this increase in the daily time frame, the weekly chart shows a very crucial resistance that has yet to be cleared.
XMR had been increasing alongside an ascending support line since March 2020. The line was validated numerous times as support (green icon), until the price finally broke down on Nov. 2021.
Now, the line has turned to resistance (red icons). Until this line is reclaimed, the trend cannot be considered bullish by any means.
Ongoing XMR increase
Cryptocurrency trader @CryptoNTez tweeted a chart of XMR, stating that bullish continuation is on the cards if the price manages to clear $250.
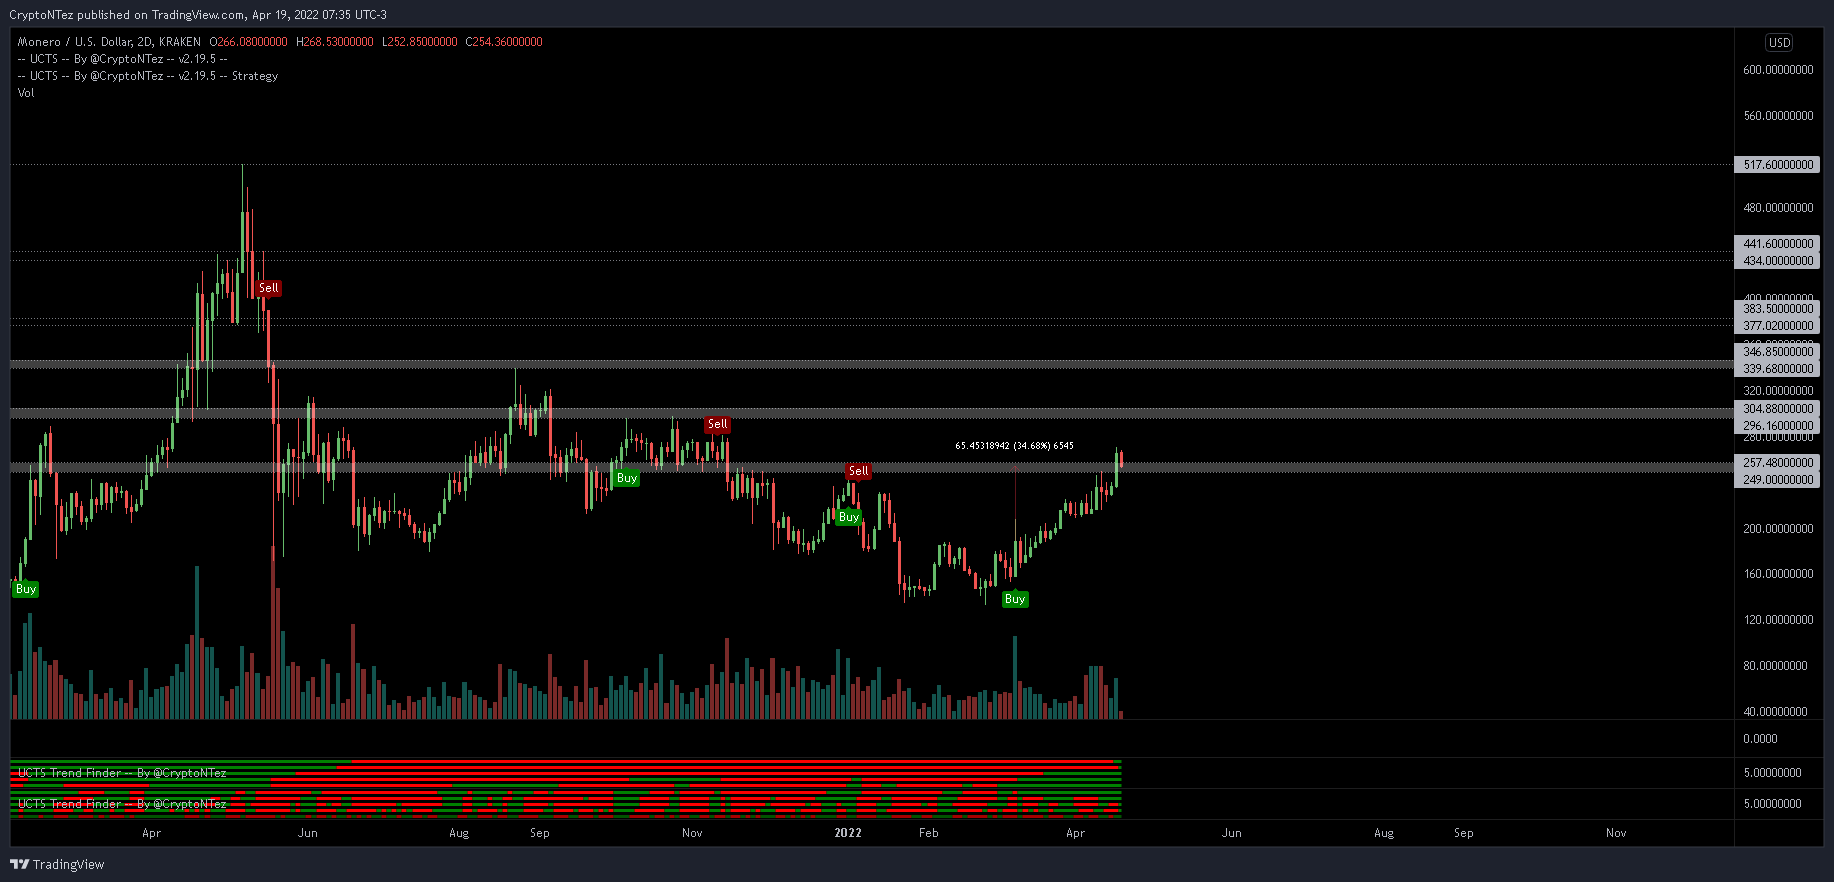
While the price has moved above this level, it is still struggling with the 0.618 Fib retracement level, as outlined above. If it is successful in moving above it, there would still be crucial resistance at $290.
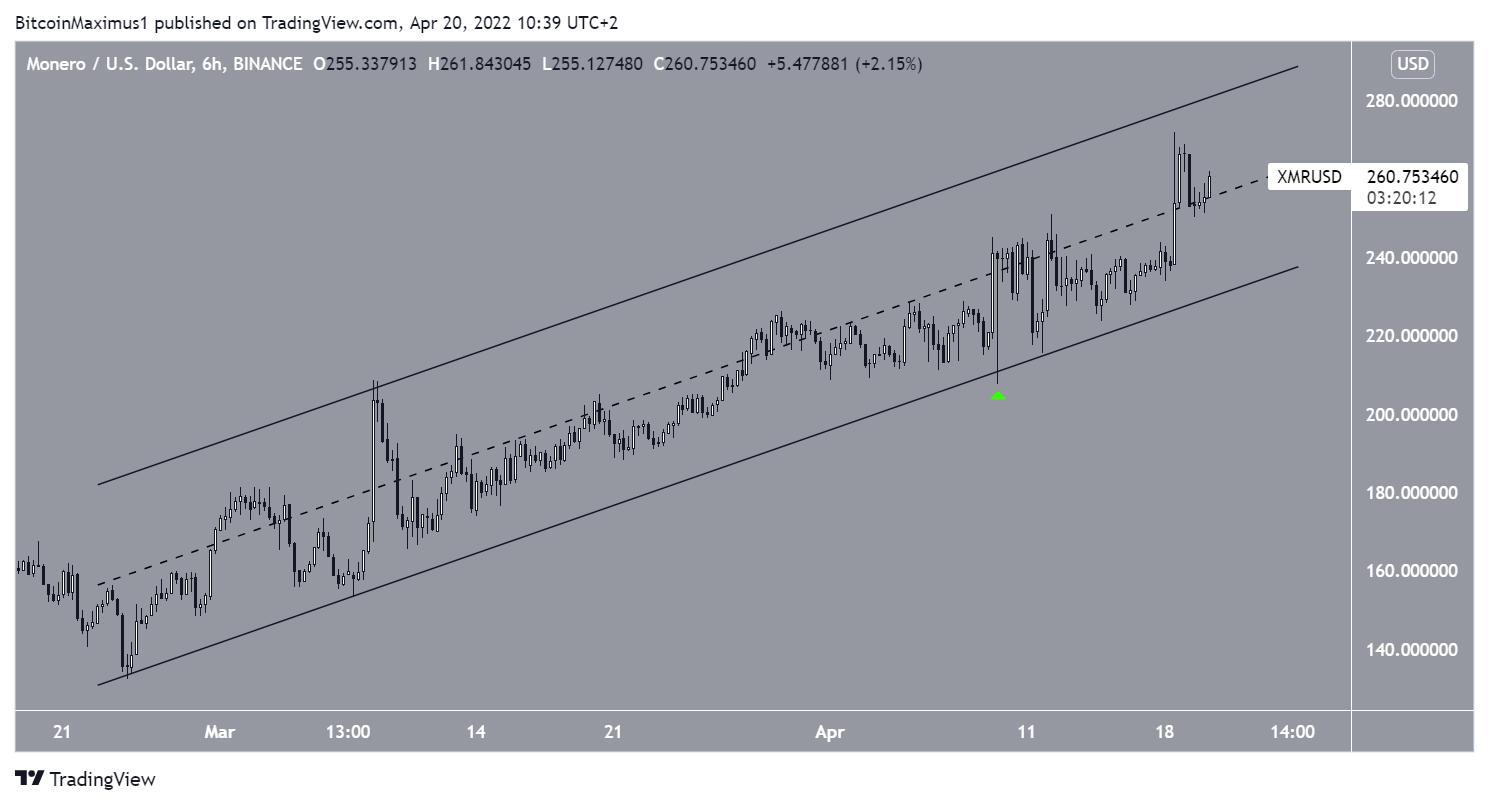
The six-hour chart shows that XMR has been increasing alongside an ascending parallel channel since Feb 24. The channel has been validated numerous times, most recently on April 9 (green icon).
On April 20, the price moved above the middle of the channel. The resistance line of the channel is at $290, aligning with the previously outlined resistance area.
Due to the confluence of resistance levels, a rejection could occur at this area.
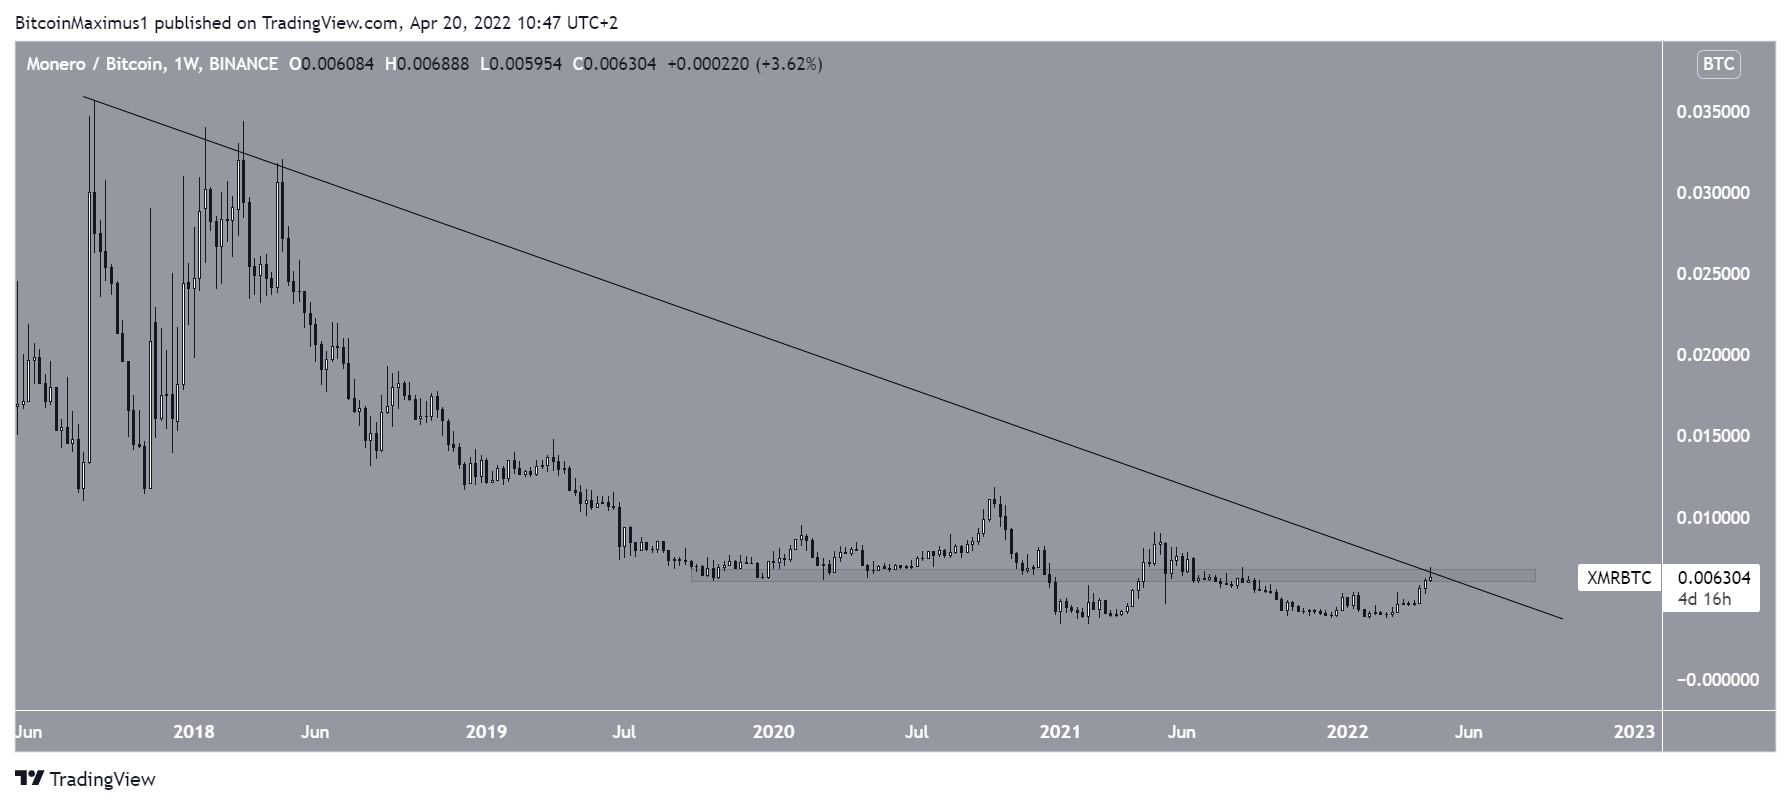
XMR/BTC
Similar to the USD pair, XMR/BTC is at a crucial level when looking at the weekly time frame.
Currently, the price is trading inside the ₿0.0065 resistance area. In addition to this, it has reached a descending resistance line that has been in place since 2018.
If it manages to break out, the rate of increase could greatly accelerate.
For Be[in]Crypto’s latest Bitcoin (BTC) analysis, click here
Trusted
Disclaimer
In line with the Trust Project guidelines, this price analysis article is for informational purposes only and should not be considered financial or investment advice. BeInCrypto is committed to accurate, unbiased reporting, but market conditions are subject to change without notice. Always conduct your own research and consult with a professional before making any financial decisions. Please note that our Terms and Conditions, Privacy Policy, and Disclaimers have been updated.
