
Wall Street Has Figured Out What It Takes To Fight Inflation
The scales have finally fallen from investors' eyes, and they saw that the Fed had to be hawkish. However, do they take into account the 4.5% FFR?
High Five
With the crowd reacting rather than anticipating, consensus rate hike expectations have materially shifted on Wall Street. Moreover, while I’ve been warning for months that the U.S. federal funds rate (FFR) needed to go much higher than many expected, suddenly, the consensus aligns with our way of thinking. To explain, I wrote on Aug. 1:
While the consensus assumes the Fed is near the end of its rate hike cycle, the Consumer Price Index (CPI) is on the fast track to 2% and a 3% FFR will be enough to capsize inflation, market participants are living in fantasy land.
For example, I’ve warned on numerous occasions that demand is much stronger than the consensus realizes. With Americans’ checking account balances at unprecedented all-time highs and the Atlanta Fed’s wage growth tracker hitting an all-time high in June, the FFR needs to go meaningfully above 3%. I wrote on Jul. 25:
With more earnings calls showcasing how the situation continues to worsen, market participants don’t realize that the U.S. federal funds rate needs to hit ~4.5% or more for the Fed to materially reduce inflation. For context, the consensus expects a figure in the 2.5% to 3.5% range.
Thus, what a difference ~two months makes. With strategists increasing their FFR projections and the new consensus calling for 4% to 5% (roughly 4.5% is now priced in), the crowd is always late to the party.
Please see below:
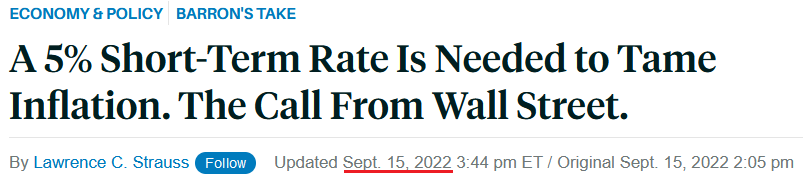
Source: Barron’s
To that point, while I warned repeatedly that the FFR needs to eclipse the inflation rate to curb the pricing pressures, suddenly, Wall Street is waking up to this reality as well.
Please see below:
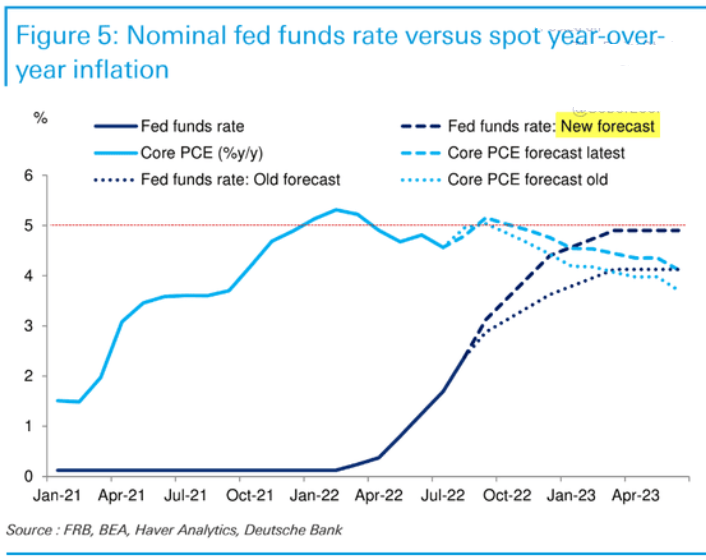
To explain, Deutsche Bank increased its FFR projection from ~4% to 5% and told clients how the FFR has always risen above the year-over-year (YoY) percentage change in the core Personal Consumption Expenditures (PCE) Index to reduce inflation. Furthermore, with the core PCE peaking at 5.31% (so far), market expectations have moved closer to reality.
More importantly, a realization is profoundly bearish for gold, silver, mining stocks and the S&P 500. For example, the U.S. 10-Year real yield hit another 2022 high of 1.07% on Sep. 16, and the metric is only 10 basis points away from its 2018 high. In addition, further rate hikes are bullish for the USD Index and the U.S. 10-Year real yield, which means the PMs confront a treacherous fundamental environment in the months ahead.
On top of that, while I warned that consumer demand was much more resilient than the consensus realized, the cash hoard built up by American households will make the Fed’s inflation fight highly arduous. To explain, I wrote on Mar. 31:
There is a misnomer in the financial markets that inflation is a supply-side phenomenon. In a nutshell: COVID-19 restrictions, labor shortages, and manufacturing disruptions are the reasons for inflation’s reign. As such, when these issues are no longer present, inflation will normalize and the U.S. economy will enjoy a “soft landing.”
However, investors’ faith in the narrative will likely lead to plenty of pain over the medium term. For example, I’ve noted for some time that the U.S. economy remains in a healthy position; and with U.S. consumers flush with cash and a red-hot labor market helping to bloat their wallets, their propensity to spend keeps economic data elevated.
Likewise, while most investors assumed that consumer spending and inflation would fall off a cliff when enhanced unemployment benefits ended in September, the reality is that neither will die easily.
U.S. households have nearly $3.89 trillion in their checking accounts. For context, this is 288% more than Q4 2019 (pre-COVID-19). As a result, investors misunderstand the amount of demand that’s driving inflation.
To that point, the Fed updated the data on Sep. 9; and with the metric hitting another all-time high, American households have nearly $4.708 trillion in their checking accounts (as of Q2), a 357% increase from Q4 2019.
Please see below:
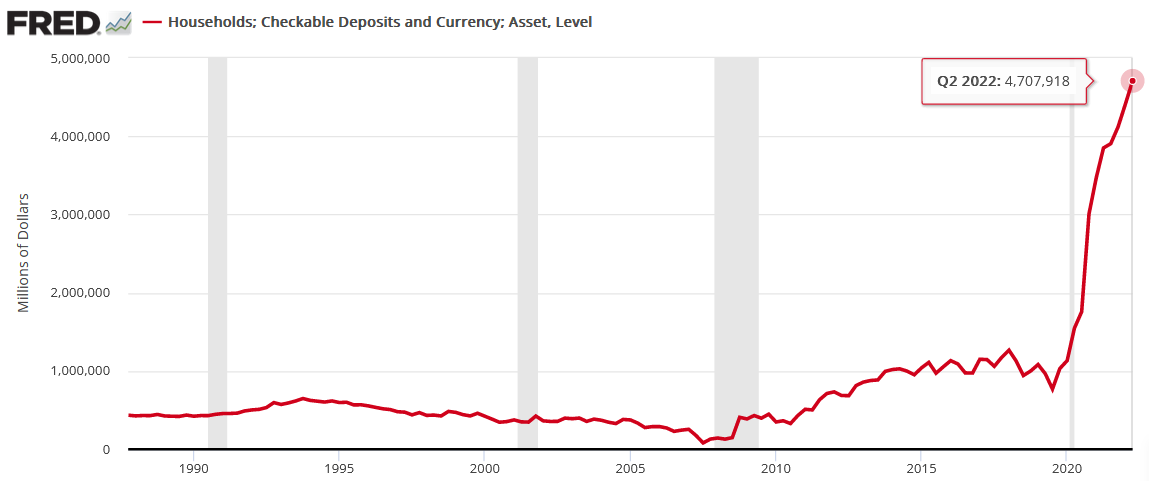
Furthermore, the Q2 figure is 6.7% higher than Q1. So while the old narrative assumed that Americans had exhausted all of their spending power, and therefore, inflation would subside, the reality is that Americans have more money in their checking accounts now than in 2021. As such, the Fed will have to keep its foot on the hawkish accelerator, and a realization has ominous implications for risk assets.
More Is Needed
With the next FOMC meeting scheduled for Sep. 20-21, the real story is whether or not officials increase their median FFR projection. Moreover, with inflation slowing at a snail’s pace, a higher-for-longer FFR is needed to cool the pricing pressures.
For example, the Cleveland Fed estimates that the headline and core CPIs will increase by 0.33% and 0.51% month-over-month (MoM), respectively, when September’s data is released on Oct. 13. Thus, the Fed’s 2022 rate hikes have done little to eliminate inflation outside of cooling the U.S. housing market.
Please see below:
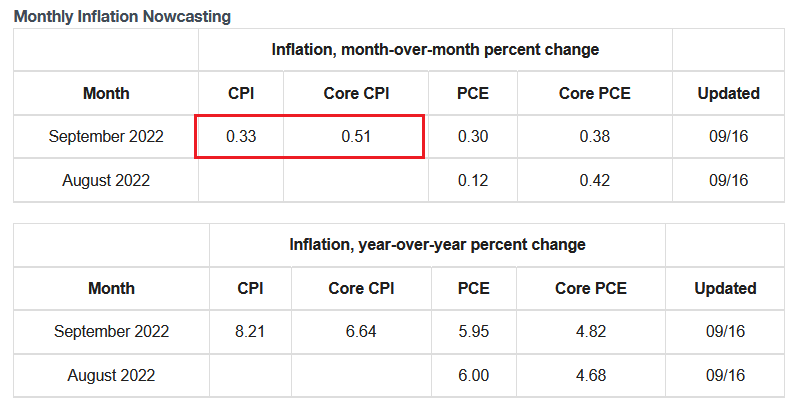
Source: Cleveland Fed
In addition, Bank of America projects that the core CPI will end 2022 at 5.9% YoY. Likewise, with the headline CPI projected to end the year even higher, the figures are nowhere near 2%.
Please see below:
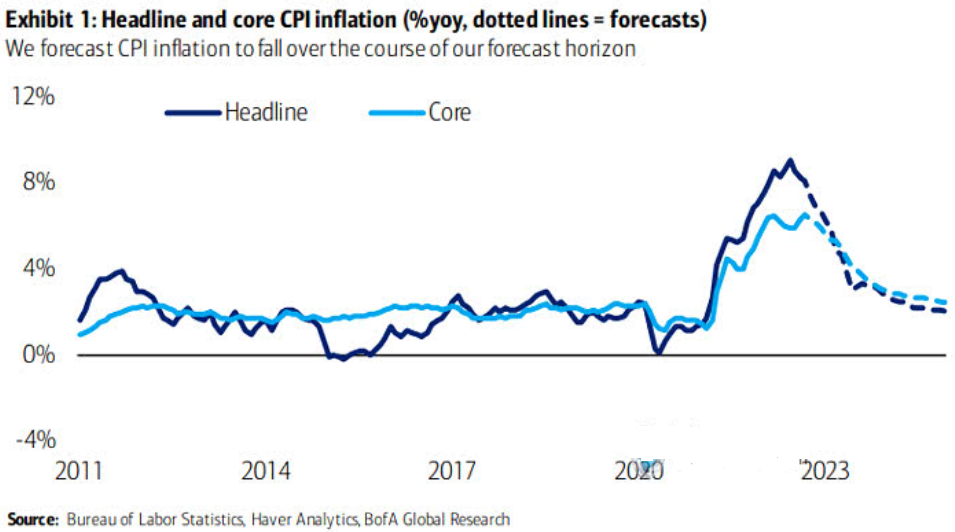
To explain, the dark and light blue lines above track the realized headline and core CPIs, while the dashed lines above represent Bank of America’s projections. If you analyze the right side of the chart, you can see that the headline and core CPIs aren’t expected to approach 2% until 2024 and beyond. As a result, the Fed can’t wait that long and will need to act in the interim to normalize the metrics.
Speaking of which, I noted above how the Cleveland Fed expects the headline CPI to increase by 0.33% MoM in September. Well, if the index maintains a similar monthly trajectory, the headline CPI will still be north of 4% YoY in Q2 2023.
Please see below:
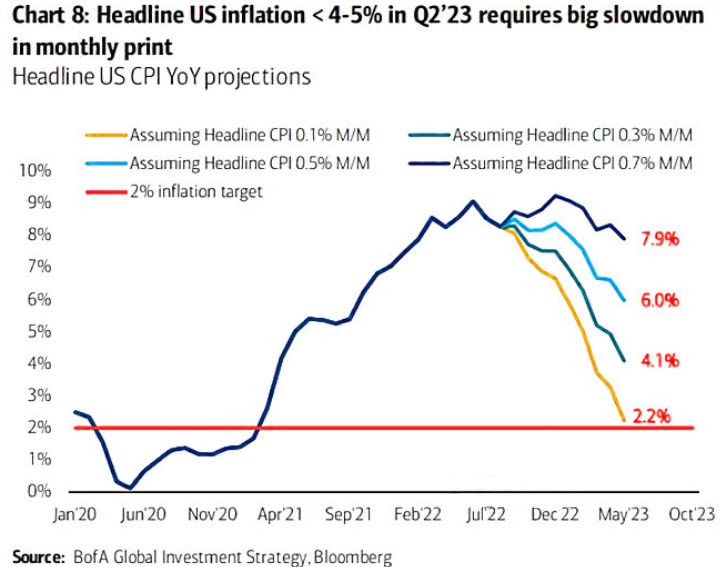
To explain, the various lines above track the YoY path of the headline CPI, assuming constant MoM prints. If you analyze the teal line, 0.30% MoM readings will equate to a 4.1% YoY reading in Q2 2023.
However, it’s important to remember that while lower commodity prices are bearish for the headline CPI, they’re bullish for the core CPI. Remember, less money spent on oil, gas, and food affords Americans more cash to spend on discretionary items. Therefore, it’s no surprise that the headline CPI declined YoY in August (the red line below), while the core CPI increased YoY in August (the green line below).
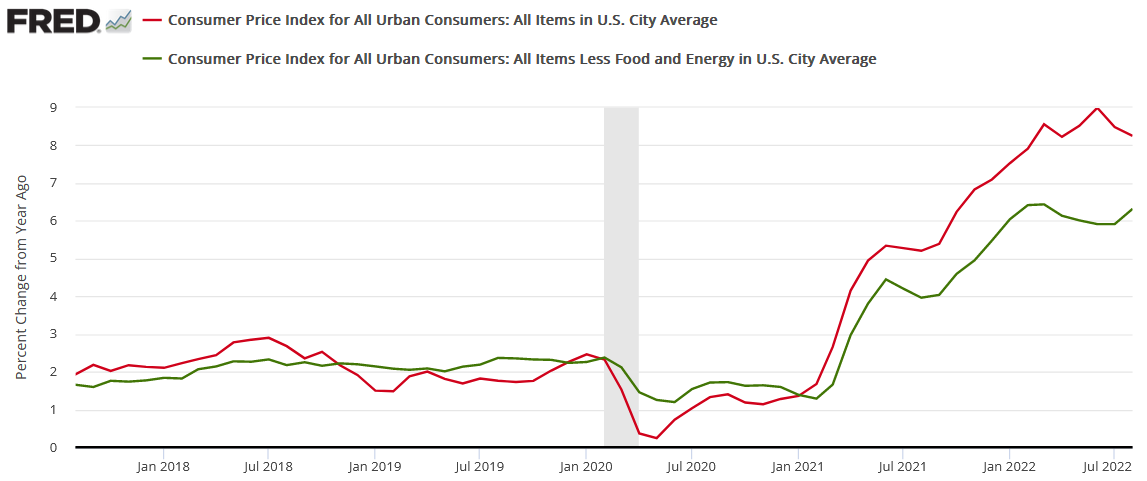
Thus, even though a headline CPI of 4.1% is roughly double the Fed’s 2% target, there is much more to this inflation story than food and energy. As such, the Fed should target Americans’ discretionary spending to alleviate inflation. Since 1954, every inflation fight has ended in a recession.
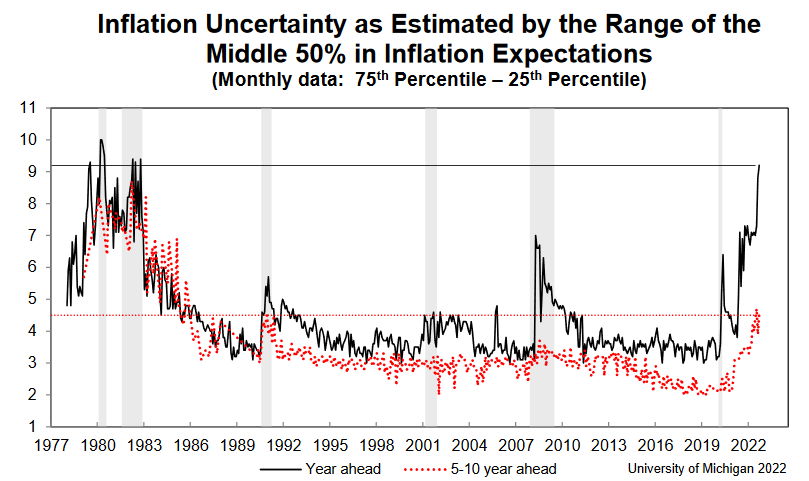
Finally, the University of Michigan released its Consumer Sentiment Index on Sep. 16. Moreover, while Americans’ inflation expectations declined, the report revealed:
“It is unclear if these improvements will persist, as consumers continued to exhibit substantial uncertainty over the future trajectory of prices. Uncertainty over short-run inflation reached levels last seen in 1982, and uncertainty over long-run inflation rose from 3.9 to 4.5 this month, well above the 3.4 level seen last September.”
As a result, with Americans extremely anxious about the year-ahead inflation outlook (the black line below), the Fed has plenty of work to do to restore its credibility.
The Bottom Line
While the crowd now sees things from our perspective, the hawkish ramifications of a 4.5% to 5.5% FFR are still far from priced in. For example, reducing Americans’ discretionary spending is profoundly bearish for S&P 500 companies’ earnings. Therefore, while households still have plenty of money to spend, weakening the U.S. labor market, reducing wages, and forcing Americans to draw down their checking account balances should have drastic implications in the months ahead.
Furthermore, the liquidity beneficiaries should suffer the most, and gold, silver, and mining stocks are highly sensitive to the performance of the USD Index and the U.S. 10-Year real yield.
In conclusion, the PMs were mixed on Sep. 16, as the GDXJ ETF ended the day in the red. Moreover, with the Fed hawked up and the U.S. 10-Year real yield continuing its ascent, the PMs’ medium-term outlooks continue to worsen. As such, we expect lower lows to materialize in the months ahead before long-term buying opportunities emerge.
More By This Author:
Gold Fell Under Its 2021 Lows; Ready For The Real Slide?Do Investors Still Believe That The Fed Is A Miracle Worker?
Let’s Go Back To 2013 And Take A Look At The GDXJ Bearish Clues
Disclaimer: All essays, research and information found on the Website represent the analyses and opinions of Mr. Radomski and Sunshine Profits' associates only. As such, it may prove wrong ...
more

