
Why Ford Stock Looks Set To Reverse

Photo courtesy of Ford
Ford Motor Co F was falling over 5% lower on Monday in sympathy with the general markets, which saw the S&P decline 2.68%.
The legacy-turning-electric vehicle manufacturer has been trading in a fairly consistent downtrend since Jan. 13, losing 47% of its value since that date.
A downtrend occurs when a stock consistently makes a series of lower lows and lower highs on the chart.
The lower lows indicate the bears are in control while the intermittent lower highs indicate consolidation periods.
Traders can use moving averages to help identify an uptrend, with descending lower timeframe moving averages (such as the eight-day or 21-day exponential moving averages) indicating the stock is in a steep shorter-term downtrend. Descending longer-term moving averages (such as the 200-day simple moving average) indicate a long-term downtrend.
A stock often signals when the lower low is in by printing a reversal candlestick such as a doji, bullish engulfing or hammer candlestick. Likewise, the lower high could be signaled when a doji, gravestone or dragonfly candlestick is printed. Moreover, the lower lows and lower highs often take place at resistance and support levels.
In a downtrend, the "trend is your friend" until it’s not, and in a downtrend, there are ways for both bullish and bearish traders to participate in the stock:
- Bearish traders who are already holding a position in a stock can feel confident the downtrend will continue unless the stock makes a higher high. Traders looking to take a position in a stock trading in a downtrend can usually find the safest entry on the lower high.
- Bullish traders can enter the trade on the lower low and exit on the lower high. These traders can also enter when the downtrend breaks and the stock makes a higher high, indicating a reversal into an uptrend may be in the cards.
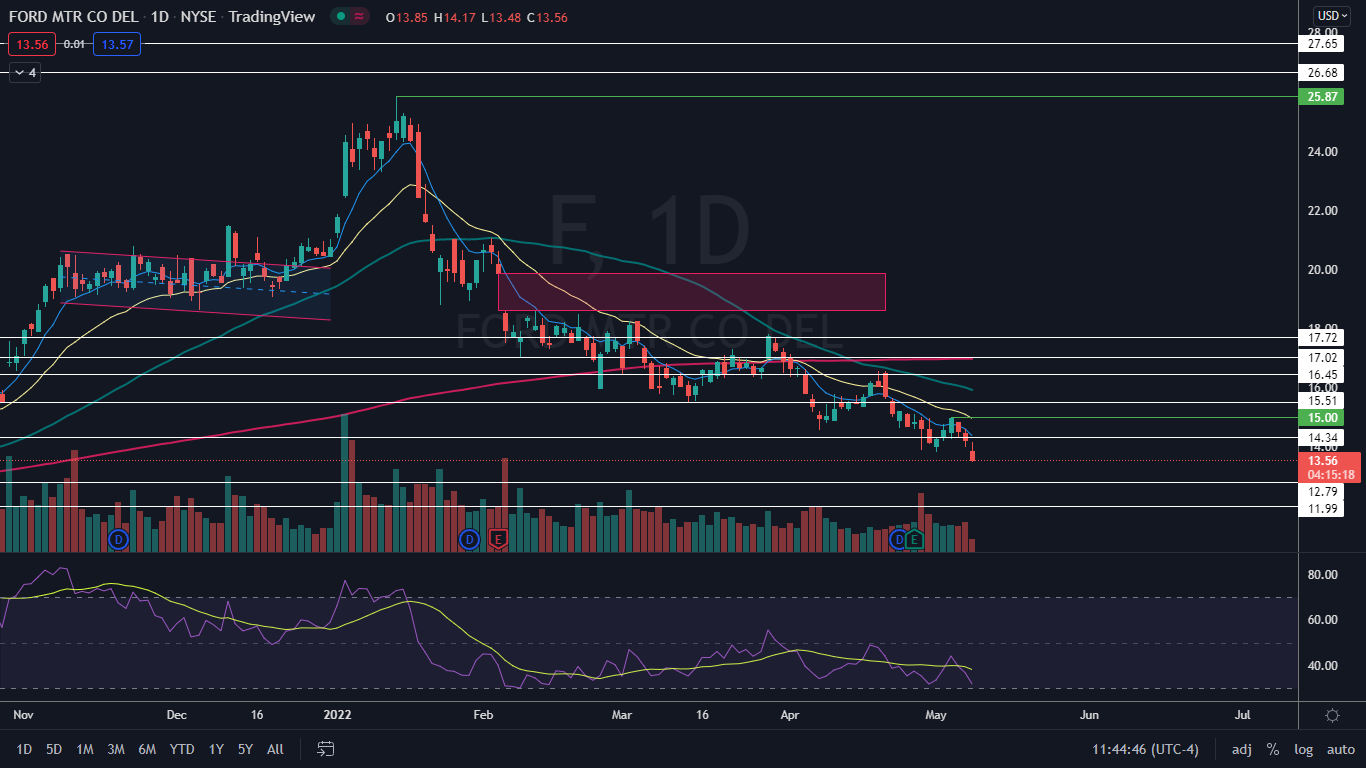
The Ford Chart: Although the bears are in control of Ford’s stock, a bounce to the upside is likely to take place over the coming days because Ford’s relative strength index (RSI) has reached the 30% level, which puts the stock into oversold territory. When Ford’s RSI reached the level on April 29, the stock bounced up about 8% over the three trading days that followed.
- When Ford bounces up to form, at least, its next lower high, bearish traders and investors can watch for a reversal candlestick, such as a doji or hammer candlestick, to form below the most recent lower high of $15, which was printed on May 4.
- Bullish traders wanting to scalp a bounce can watch for a volume climax to take place over the coming days or for a reversal candlestick to form, which could indicate the bounce is imminent. If Ford closes the trading session near its low-of-day price, there could be more downside before a bounce occurs.
Ford has resistance above at $14.34 and $15.51 and support below at $12.79 and $11.99.
(Click on image to enlarge)
© 2022 Benzinga.com. Benzinga does not provide investment advice. All rights reserved.


