Perspectives On The Current Crypto Slump
I’ll avoid the usual platitudes about the market downturn. Instead, I’d like to focus on how we can better understand the current cryptocurrency market movement by looking at the S&P Cryptocurrency Indices. First, to set the context for the current drawdown, we’ll take a look at the biggest declines in Bitcoin. Then, we’ll take a more detailed look at the performance of specific cryptocurrency market-cap segments in this period.
Setting the Context
Even before the current downturn, most would agree—and the data shows—that there is a significant amount of volatility in the cryptocurrency market. The initial S&P Cryptocurrency Indices, as reported in our whitepaper and based on back-tested data, have frequently experienced high annualized returns, accompanied by significant volatility and downside risk (see charts on pages 15-16 of the whitepaper.)
When we look at the S&P Bitcoin Index specifically, we can see that the two largest drawdowns since inception were 76% and 71%. The first one started in late 2017 and lasted more than a year. The second one dates back to 2014 and also lasted more than a year. (Drawdowns are within the back-tested history of the index, starting Jan. 1, 2014). The third-largest drawdown was 40%, significantly less than the two largest and also more recent, in 2021 (see Exhibit 1).

If we compare these drawdowns with the most recent period of decline (from March 28, 2022, to May 11, 2022), the drawdown was 39%. In other words, the current market drop is competing for third place in the list of largest historical drawdowns of the S&P Bitcoin Index on our record.
In times of significant market declines, it is particularly helpful to view the recent market environment in the context of earlier drawdowns. In the current case, the context shows that the asset class has been through worse conditions. For those who have started following cryptocurrency more recently, there is a term “crypto winter,” which describes past sharp declines in price followed by a period of little growth. Whether the market will head into winter or rebound remains to be seen.
Performance of the Broader Cryptocurrency Market
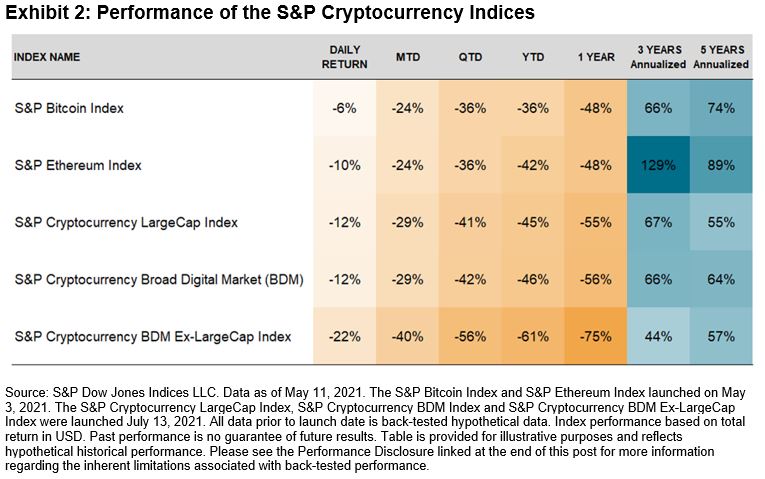
Looking at the S&P Cryptocurrency Indices overall, we can see that performance has varied based on market cap YTD.
In general, the coin-related indices with the largest market cap have experienced relatively smaller declines (see Exhibit 2). Specifically, the S&P Bitcoin Index and S&P Ethereum Index have fared better than the other broad indices. Whether this weathering is a function purely of market cap, or also due to the fact that these are the oldest, most liquid coins, is not easy to parse.
As we move down the cap table, we can see the worst-performing index YTD was the S&P Cryptocurrency BDM Ex-LargeCap Index. This index includes over 350 smaller coins and does not include the potentially stabilizing influence of Bitcoin or Ethereum. This performance too suggests that the market has historically favored the large-cap coins over small-cap coins.

Finally, it’s worth noting that S&P DJI does not include stablecoins or any other pegged digital assets in our existing cryptocurrency indices. This exclusion is because, while stablecoins may be considered an essential part of the cryptocurrency ecosystem, they do not necessarily reflect growth (or declines) in the market.
The recent events with stablecoin UST (TerraUSD) and its companion Luna, however, show that stablecoins can lose their peg, decline rapidly in the market and create systemic risk to crypto market stability overall.1
For more information about the S&P Cryptocurrency Indices, please see here.
1 https://www.nytimes.com/2022/05/12/technology/cryptocurrencies-crash-bitcoin.html
Disclaimer: See the full disclaimer for S&P Dow Jones Indices here.


