
XRP (XRP) is presently trading up 1.53% at $0.431 in line with the latest crypto market rebound attempt. On the weekly chart, XRP has printed eight consecutive red weekly candles. The last time XRP was this oversold, it found itself in the midst of one of its biggest bullish runs, surging nearly 39,000 percent to reach an all-time high of $3.84 on January 4, 2018. The Ripple vs SEC lawsuit is now in its next phase—the summary judgment schedule—however, the struggle over the Hinman documents continues. Ripple Labs continues to show indications of hope, including the recent lease of an entire facility in San Francisco, California. “Seeing as most commercial leases are 5 years, this does not seem the hallmark of a company that is planning to relocate its headquarters,” stated XRP-friendly Jeremy Hogan.
Key Levels
Resistance Levels: $0.6950, $0.5500, $0.4700
Support Levels: $0.4000, $0.3610, $0.3330
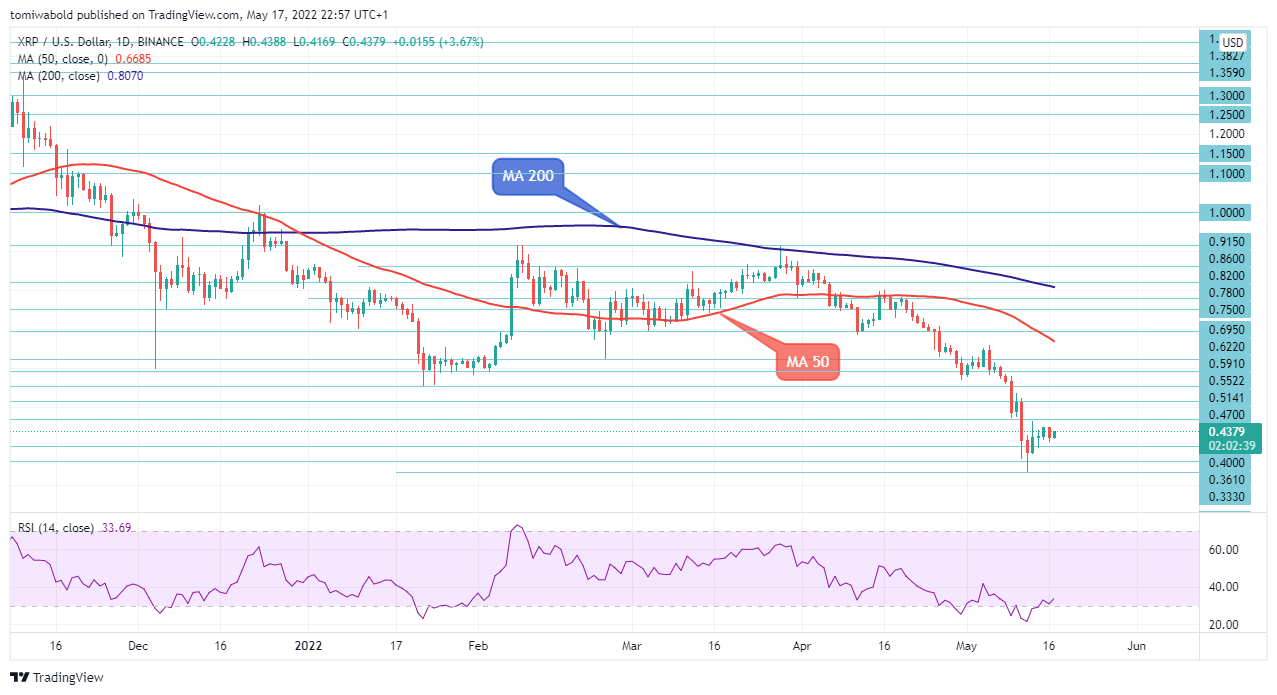
As indicated by the rebound from $0.3330 to $0.4638 at $0.4388, the XRP pullback from $0.9131 on Mar. 28 was most likely only a corrective move in the near term. That is to say, the rebound from $0.3330 could continue. The pair is currently trading below its daily moving average (MA 50), implying a medium-term consolidation trend might have set in.
During the upcoming trading session, bullish traders could aim for the $0.4700 horizontal level. A pullback to the $0.3330 lift-off zone is possible while the momentum is still strong, but only in small rallies. A breakout above the $0.4700 level would indicate that buyers have regained control of the market, and the price may be headed for $0.5500 and beyond.
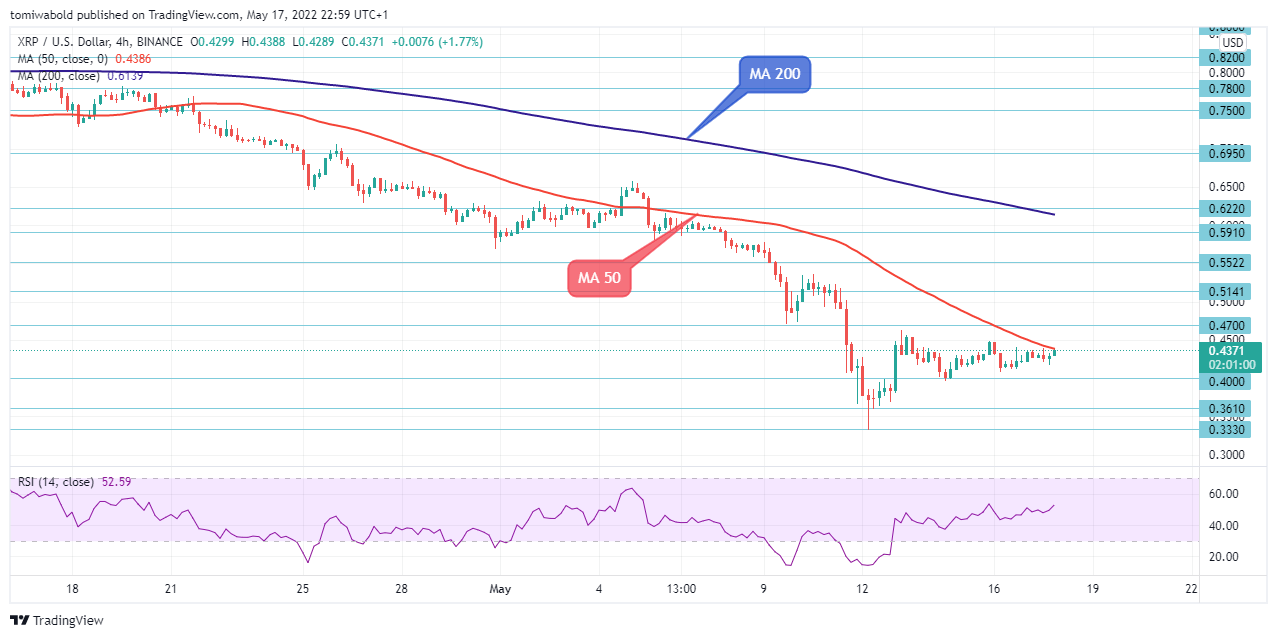 XRP/USD 4-Hour Chart
In a bid to surge through the 4-hour moving average (MA 50) levels, the XRP/USD is now attempting to break through the $0.4400 level. If the price breaks below the $0.4000 support, it may test the $0.3610 level. A close around this support level might quickly intensify a negative trend. The positive pressure will ease if the price falls below, exposing the next support level at $0.3330.
A short-term bottom would be indicated by a breach of $0.3330. However, currently, the intraday bias is modified upward in anticipation of a greater surge. If the $0.4700 level is broken, the $0.5500 resistance level might be approached next. However, before making a substantial increase, local hurdles will limit the pair’s future advances.
Note: Kryptomoney.com is not a financial advisor. Do your research before investing your funds in any financial asset or presented product or event. We are not responsible for your investing results
Image Credit: Shutterstock


Keep in mind that we may receive commissions when you click our links and make purchases. However, this does not impact our reviews and comparisons. We try our best to keep things fair and balanced, in order to help you make the best choice for you.