Two Trades To Watch: EUR/GBP, Oil - Wednesday, May 18
EURGBP edges higher after UK inflation data. Oil rises amid optimism over Shanghai COVID cases.

Pixabay
EURGBP edges higher after UK inflation data
EURGBP is falling following a slight miss in UK inflation data (FXE, FXB).
UK CPI jumped to 9%, a 40-year high in April, up from 7% in March but came in slightly short of forecasts of 9.1%. Core CPI rose to 6.2%, up from 5.7%.
A 54% rise in energy prices, higher food and fuel prices, council tax, and an 8% drop in the pound’s value over recent months have contributed to surging inflation.
The data comes following yesterday’s jobs data which showed unemployment dropped to a 48-year low and that there are few unemployed people than job vacancies.
Looking ahead, Eurozone inflation data is expected to confirm the 7.5% YoY preliminary reading.
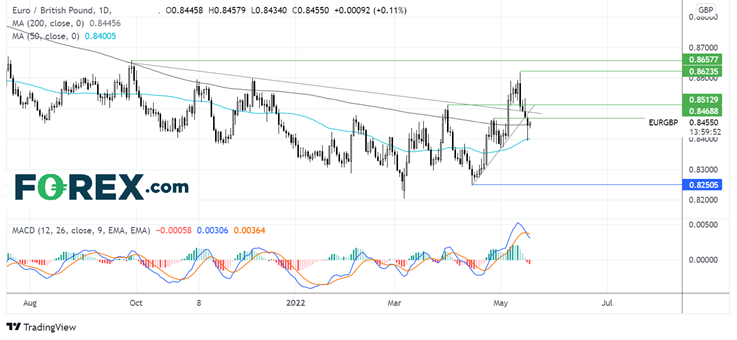
Where next for EUR/GBP?
After a 4-day downtrend, the bears are pausing for breath. The pair has fallen below its multi-month falling trendline and below its month-old rising trendline, which, when combined with the bearish crossover on the MACD, keeps sellers hopeful of further downside.
The pair found support yesterday on the 50sma at 0.84 and is testing the 200 sma at 0.8450. Failure to retake the 200 sma could see the pair head back towards 0.84, with a break below here needed to create a lower low.
Should the bulls push above the 200 SMA resistance at 0.8475 and the crossover of the falling and rising trendline at 0.8485 could be a tough nut to crack ahead of 0.8510.
Oil rises amid optimism over Shanghai COVID cases
Oil prices are on the rise on optimism that easing COVID cases in China could see lockdown restrictions relaxed, boosting demand for oil and after data showed a drawdown in inventories.
Shanghai has achieved the milestone of three straight days with no COVID cases outside quarantine zones. Some financial institutions are returning to work in the key financial district.
US crude stockpiles fell by 2.4 million barrels for the week ending May 13, and EIA data is due later today.
This news overshadows the news that the EU has failed to persuade Hungary to back the Russian oil ban, which it is struggling to push through.
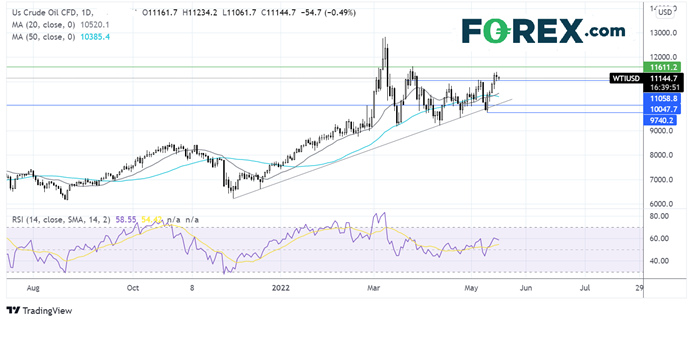
Where next for oil prices?
Oil prices have extended the rebound from 97.34, the May low, recapturing the 20 & 50 sma and a key resistance at $110.80, which now acts as the immediate support for the price.
The price trades above six month rising trendline, the 20 SMA has crossed above the 50 SMA in the latest bullish signal, and the RSI supports further upside.
Buyers will now look to break above $116.30 to continue the uptrend.
Sellers will need to break below 110.80 to expose the 20 sma at 104.75 and the 50 snap at 104.00. It would take a move below 97.34 to create a lower low.