
Bitcoin has been hovering around $30,000, pushing the rest of the crypto market to balance falls and gains. Per CoinMarketCap, the total crypto market capitalization is up 2.56% over the last day to $1.28 trillion. The dominance index for Bitcoin stayed at 45 percent. The overall crypto market is attempting to recover from the recent spike in global inflation and Stablecoins de-pegging. BTC has managed to hold above its May lows of $25,338, raising hopes that selling pressure is waning. However, a loss of less than $25,000 might invalidate the analysis. BTC/USD continues to hover around the $30,000 psychological zone after a sharp rebound from the recent large sell-off. Zhu Su, a co-founder of Three Arrows Capital, believes that Bitcoin has entered an accumulating phase. Per Zhu Su, Bitcoin is exhibiting exceptional strength against stocks, with Asian trading hours now outperforming US trading hours.
Key Levels
Resistance Levels: $43,000, $38,000, $33,000
Support Levels: $25,000, $22,000, $20,000
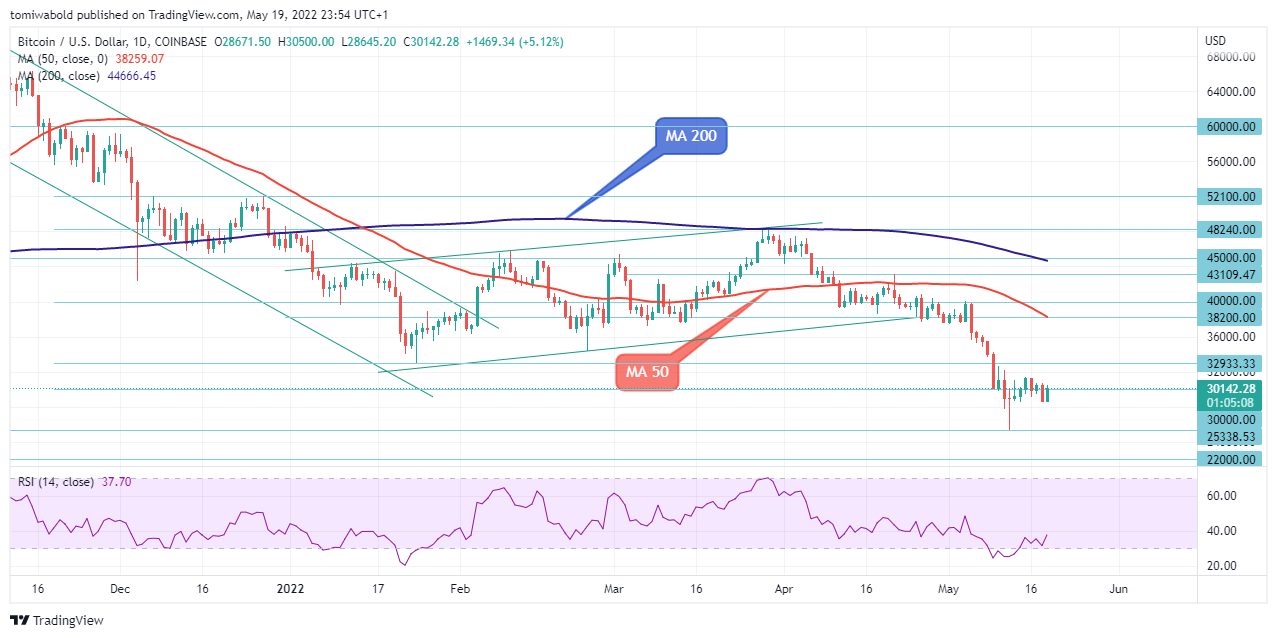 BTC/USD Daily Chart
The BTC/USD pair is growing as Bitcoin strengthens. On Thursday, May. 19, it began trading at $28,671.50 and might end above $30,000 on the daily chart. The daily movement is positive, at above 4%. It should also be remembered that it was below $30,000 the day before. Concerns about the downside pushed the BTC/USD lower during the prior day.
As a result, the market sank to a low of $28,605. After BTC rallied off the lower line of the bearish trend during the session, buyers might push the price higher in the next trading session. However, the moving average (MA 200) at $38,200 might limit its long-term trend in the next few sessions. Before a bearish relief, Bitcoin must reclaim the $38,200 moving average (MA 50) and consolidate.
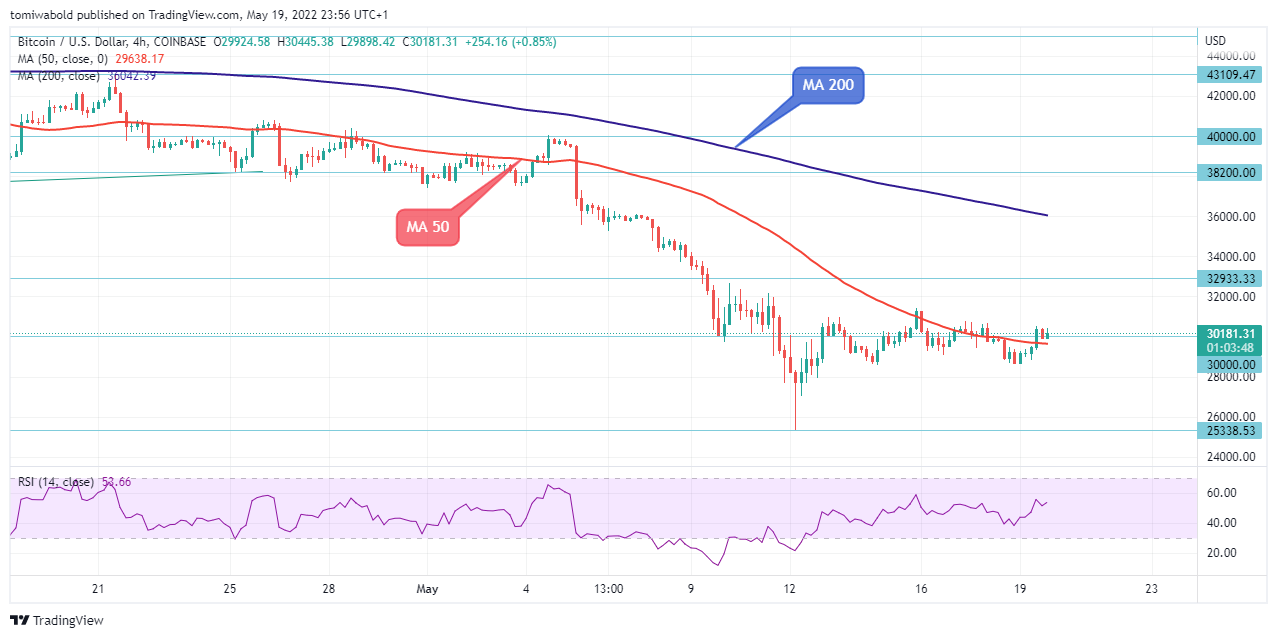 BTC/USD 4-Hour Chart
BTC/USD has broken above the $30,000 psychological zone, which is now a key area, and is back over the 4-hour moving average (MA 50). Given that the pair’s Relative Strength Index signal is back above its moving average (MA 50). Despite occasional signs of volatility, major investors prefer to have a positive bias toward Bitcoin.
If selling pressure returns, the pair may aim for, if not break, the $25,000 support zone, with a larger break clearing the way for the $20,000 psychological barrier. Overall, only a successful breach of the $38,200 target might alter traders’ and investors’ neutral sentiments.
Note: Kryptomoney.com is not a financial advisor. Do your research before investing your funds in any financial asset or presented product or event. We are not responsible for your investing results
Image Credit: Shutterstock


Keep in mind that we may receive commissions when you click our links and make purchases. However, this does not impact our reviews and comparisons. We try our best to keep things fair and balanced, in order to help you make the best choice for you.
