

Canada Goose Holdings (GOOS) (TSE:GOOS) designs, manufactures, distributes, and retails outerwear for men, women, and children. It operates through the Wholesale and Direct to Consumer segments.
The Wholesale segment comprises sales made to a mix of functional and fashionable retailers, including department stores, outdoor specialty stores, individual shops, and international distributors.
The Direct-to-Consumer segment refers to the online sales through its ecommerce sites to customers in Austria, Belgium, Canada, China, France, Germany, Ireland, Luxembourg, the Netherlands, Sweden, the United Kingdom, and the United States, and sales to customers from company-owned retail stores in Boston, Calgary, Chicago, London, New York City, and Toronto.
The company was founded in 1957 and is headquartered in Toronto, Canada.
We are neutral on the stock.
Recent Earnings Report
Canada Goose reported an adjusted earnings per share figure of $0.04, beating the consensus estimate by $0.05. Revenue slightly missed by $360 thousand, coming in at $223.1 million.
More importantly, the company raised its guidance for Fiscal Year 2023. GOOS now expects revenue in the range of $1.3 – $1.4 billion with EPS of $1.60 – $1.90. Analysts had expected forward estimates of $1.3 billion and $1.61 for revenue and EPS, respectively.
The company cited its Canadian manufacturing as the reason for being able to remain “uniquely insulated” from supply chain and inflationary issues. As a result, the company will be able to meet the demand from customers.
Competitive Advantage
Currently, Canada Goose’s Canadian manufacturing is proving to be a great competitive advantage for the company, allowing it to control costs and supplies with minimal issues. However, we can also measure its edge by looking at the financial statements.
There are a couple of ways to quantify a company’s competitive advantage using only its income statement. The first method involves calculating the earnings power value (EPV).
Earnings power value is measured as adjusted EBIT after tax, divided by the weighted average cost of capital, and reproduction value (the cost to reproduce the business) can be measured using total asset value. If the earnings power value is higher than the reproduction value, then a company is considered to have a competitive advantage.
The calculation is as follows:
EPV = EPV adjusted earnings / WACC
$2,736 million = $197 million / 0.072
Since Canada Goose has a total asset value of $1,071 million, we can say that it does have a competitive advantage. In other words, assuming no growth for Canada Goose, it would require $1,071 million of assets to generate $2,736 million in value over time.
The second method is by looking at a company’s gross margins because it represents the premium that consumers are willing to pay over the cost of a product or service. An expanding gross margin indicates that a sustainable competitive advantage is present.
If an existing company has no edge, then new entrants would gradually take away market share, leading to decreasing gross margins as pricing wars ensue to remain competitive.
In Canada Goose’s case, gross margins have expanded in the past several years. As a result, its gross margins indicate that a competitive advantage is present in this regard as well.
Risk Analysis
To measure risk, we will start off by analyzing the company’s earnings quality. We want to determine if the earnings figures are reliable or if they are being manipulated by the accountants. To do this, we will employ a method known as the Beneish M-Score, which can help us identify if a company is an earnings manipulator.
The interpretation is quite simple. If the M-Score is greater than -1.78, then the company is likely an earnings manipulator. In contrast, if the M-Score is less than -2, then the company is not likely an earnings manipulator. Lastly, a score that is between -1.78 and -2 is a possible manipulator.
Although the interpretation is simple, the calculation is not and requires many steps. The formula for this method is as follows:
M-Score =
-4.84
(+) 0.92 × DSRI
(+) 0.528 × GMI
(+) 0.404 × AQI
(+) 0.892 × SGI
(+) 0.115 × DEPI
(+) -0.172 × SGAI
(+) 4.679 × TATA
(+) -0.327 × LVGI
Where:
DSRI = Days Sales in Receivables Index
DSRI = (Net Receivablest / Salest) / (Net Receivables t-1 / Sales t-1)
GMI = Gross Margin Index
GMI = [(Sales t-1 – COGS t-1) / Sales t-1] / [(Sales t – COGS t) / Sales t]
AQI = Asset Quality Index
AQI = [(Total Assets – Current Assets t – PP&E t) / Total Assets t] / [(Total Assets – Current Assets t-1 – PP&E t-1) / Total Assets t-1]
SGI = Sales Growth Index
SGI = Sales t / Sales t-1
DEPI = Depreciation Index
DEPI = (Depreciation t-1/ (PP&E t-1 + Depreciation t-1)) / (Depreciation t / (PP&E t + Depreciation t))
SGAI = Sales General and Administrative Expenses Index
SGAI = (SG&A Expense t / Sales t) / (SG&A Expense t-1 / Sales t-1)
LVGI = Leverage Index
LVGI = [(Current Liabilities t + Total Long Term Debt t) / Total Assets t] / [(Current Liabilities t-1 + Total Long Term Debt t-1) / Total Assets t-1]
TATA = Total Accruals to Total Assets
TATA = (Income from Continuing Operations t – Cash Flows from Operations t) / Total Assets t
Now that we have defined the formula, we need to gather the data to input into the equations, which you will find in the image below:
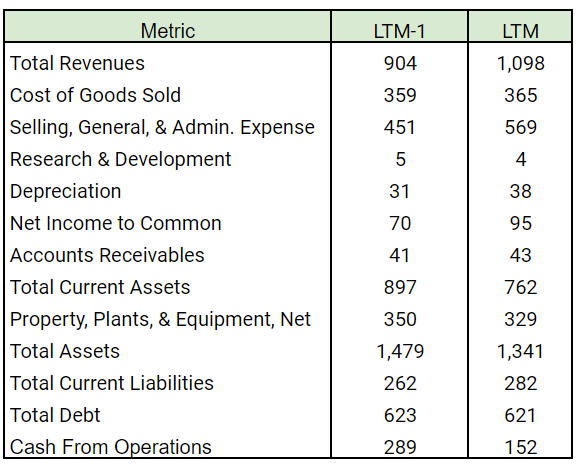
Now that we have the required data, we can carry out the calculations which we have summarized in the image below:
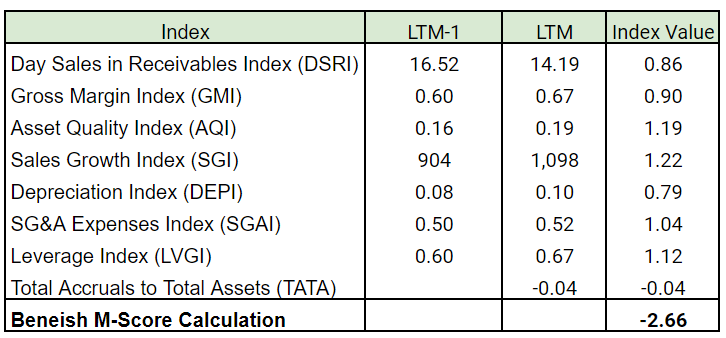
Therefore, Canada Goose is not an earnings manipulator because it has an M-Score of -2.8
In addition, there are other risks associated with the company. According to TipRanks’ Risk Analysis, Canada Goose has disclosed 52 risks in its most recent earnings report. The highest amount of risk came from the Finance & Corporate category.
The total number of risks has increased over time, as shown in the picture below.

Wall Street’s Take
Turning to Wall Street, Canada Goose has a Moderate Buy consensus rating, based on seven Buys, three Holds, and one Sell assigned in the past three months. The average Canada Goose price target of $31.78 implies 56.47% upside potential.

Final Thoughts
Canada Goose is a solid retail company with strong brand awareness. In addition, it has more control over its supply chain than most other companies, allowing it to confidently raise its outlook. Nevertheless, we remain neutral on the company.
Discover new investment ideas with data you can trust.
Read full Disclaimer & Disclosure
