
XRP price continues to trade in a sideways range, awaiting the next major move. At the time of publication, XRP was trading at $0.40, marginally down on its daily chart. Once Ripple’s case with the Securities and Exchange Commission is resolved, CEO Brad Garlinghouse says the company would consider an initial public offering. According to the SEC, Ripple, Garlinghouse, and executive chairman Chris Larsen sold XRP in an illegal securities offering. The litigation has been ongoing for nearly 15 months, with Ripple anticipating a resolution this year. Despite this, Garlinghouse claims that the company is expanding. He claimed that volume for its On-Demand Liquidity cross-border payments product, which employs XRP, totaled $8 billion in the first quarter of this year, compared to $1 billion in the same period last year.
Key Levels
Resistance Levels: $0.6220, $0.5522, $0.4700
Support Levels: $0.4000, $0.3650, $0.3323
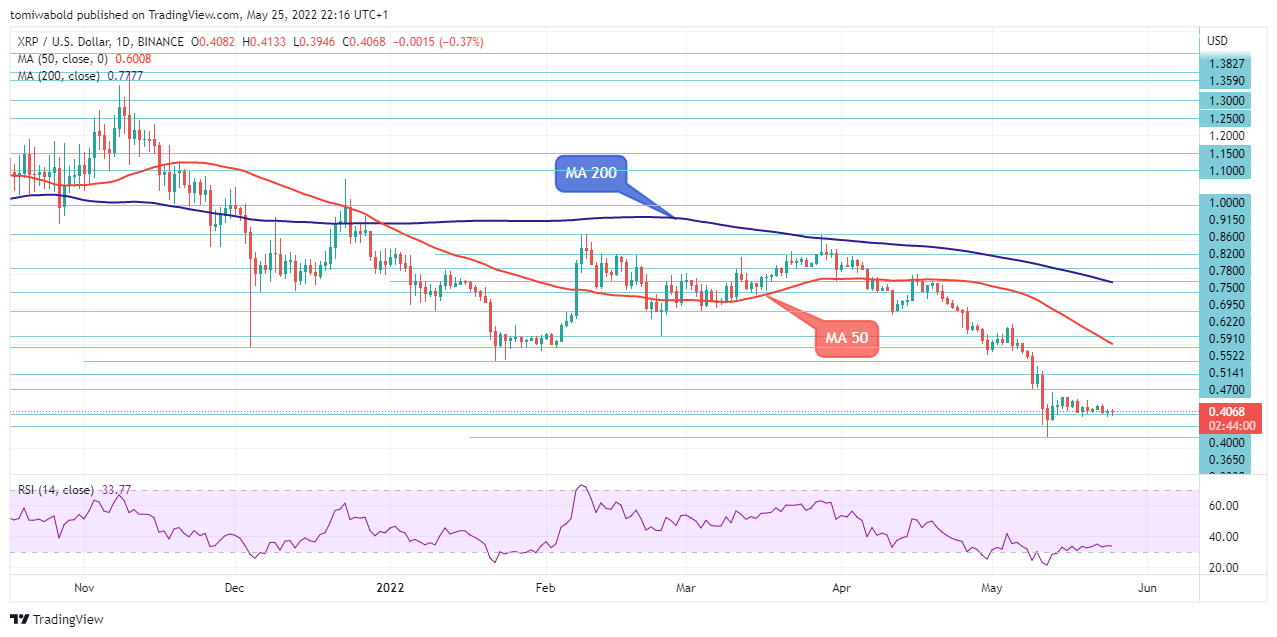 XRP/USD Daily Chart
The XRP/USD pair has loosened its bearish grip around the $0.3323 low level, but it’s gradually recovering from the bearish zone. On the daily chart, the pair is continuing to rise above the $0.4000 level, which serves as a weak support level above the recent rebound zone of $0.3323, while technical indicators like the RSI remain optimistic.
In a larger sense, the next round figure of $0.4700 remains the immediate aim. Continued trading beyond the upper horizontal line at $0.4000 might accompany a significant breakout at this point. This should confirm the $0.3323 mid-term bottom. Nonetheless, a break below $0.3650 would keep the medium-term bearish sentiment alive for another drop.
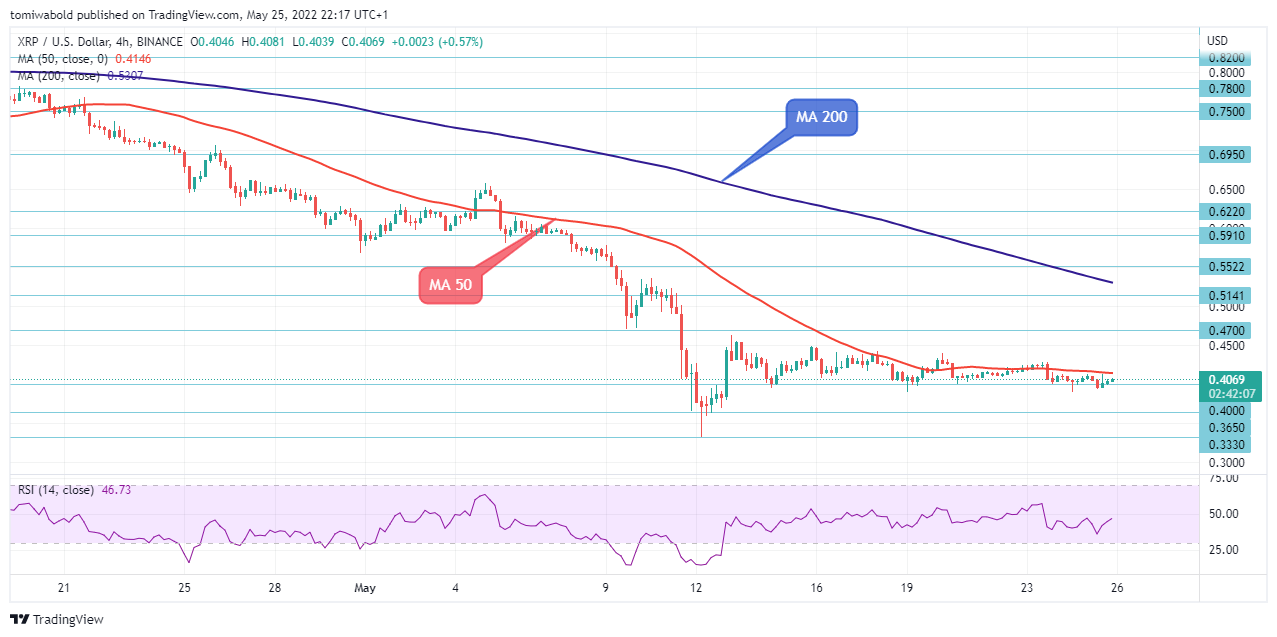 XRP/USD 4-Hour Chart
The pair has settled beneath its moving averages of 5 and 13, which are both trending lower on the 4-hour chart. Technical indicators are stuck in the middle, with little directional strength. XRP/USD on the other hand rose from $0.3323 at the low level to $0.4629 in the preceding week before reversing.
This week’s initial bias remains neutral. The XRP/USD pair, on the other hand, might seek the $0.3323 near-term low if it is unable to sustain its move above the $0.4000 resistance turned support. The recent rally from $0.3323 would be restarted if the 4-hour MA 50 and XRP top marks were decisively breached.
Note: Kryptomoney.com is not a financial advisor. Do your research before investing your funds in any financial asset or presented product or event. We are not responsible for your investing results
Image Credit: Shutterstock


Keep in mind that we may receive commissions when you click our links and make purchases. However, this does not impact our reviews and comparisons. We try our best to keep things fair and balanced, in order to help you make the best choice for you.