
Black Gold Still Hesitant Despite Bullish U.S. Crude Inventories
A drop in reserves was slightly bigger than expected, however, the crude oil market remains hesitant to break out. What’s holding it back?
Crude oil prices have been progressing very slowly during the quiet European session on Thursday, as several European countries celebrate Ascension Day and preparations for the long Memorial Day weekend are underway in the United States. We may expect some profit-takings on various commodity markets before the start of the US Summer Driving Season, however, it could be offset by an increase in gasoline demand in the forthcoming days and weeks.
Let’s keep an eye on Volatility
The Volatility Index (VIX) – aka “Fear Index” – is currently making lower highs as it can be seen in the following charts, especially on the weekly and daily charts, nevertheless, it remains well above the $20-25 zone.
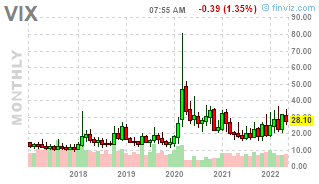
VIX (Monthly chart, Source: FINVIZ.com)
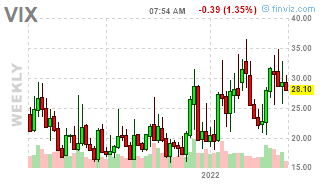
VIX (Weekly chart, Source: FINVIZ.com)
VIX (Daily chart, Source: FINVIZ.com)
If we were seeing a spike towards $40, this could signal an acceleration of volatility and would potentially precede a more violent market crash, notably marked by a sudden drop in equities…
On the contrary, if a de-escalation were going to happen in the Black Sea region, the VIX could fall back to its lower levels (except if we get fears redirected to a probable recession), below that $20-25 band. Thus, volatility represents another critical instrument on any trader’s dashboard to carefully monitor while trading financial markets.
The United States Crude Oil Inventories
This time, the weekly commercial crude oil reserves in the United States dropped a little more than the predictions, according to figures released on Wednesday by the US Energy Information Administration (EIA).

US crude inventories have decreased by over 1 million barrels, which implies slightly greater demand and is normally considered a bullish factor for crude oil prices. Here, the difference with the forecasted figure is rather low though…
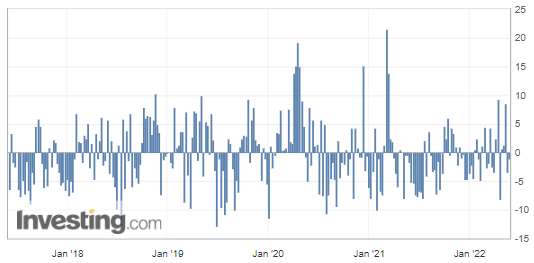
(Source: Investing.com)
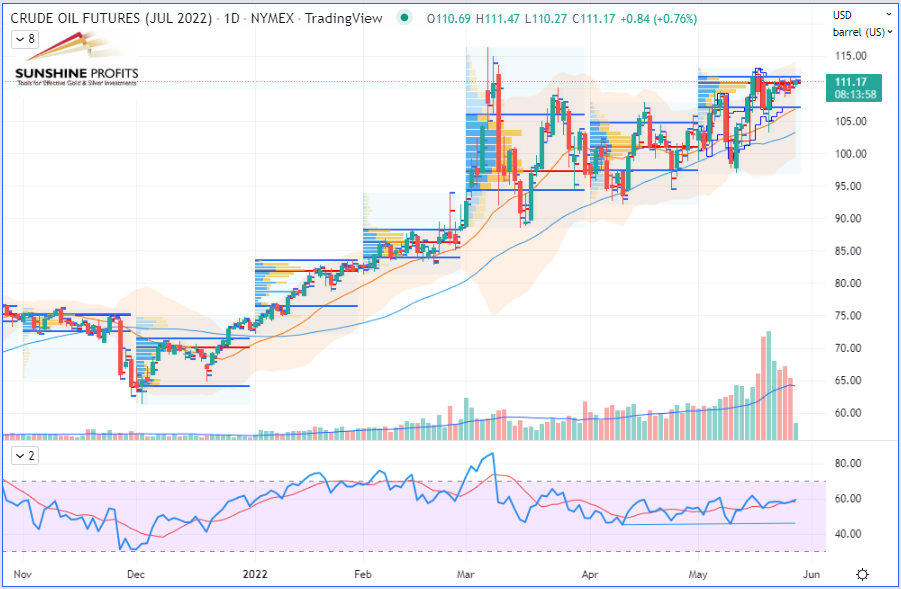
WTI Crude Oil (CLM22) Futures (June contract, daily chart)
United States Gasoline Inventories
On the other hand, some additional figures extracted from the same EIA report were released:

These are US Gasoline Reserves, which were expected to drop by 634 thousand barrels over the week. However, with 482 thousand barrels on the meter, the figure falls into the bearish side (having a lower deviation than expected), even though we may start to see accelerating demand triggered by the beginning of the Summer Driving Season in the USA in the forthcoming days or weeks.
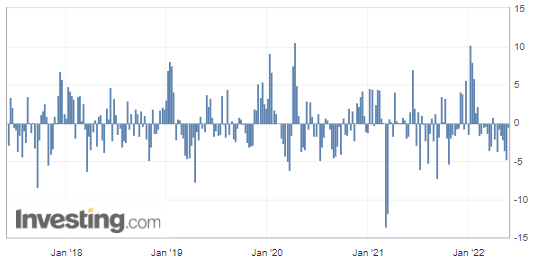
(Source: Investing.com)
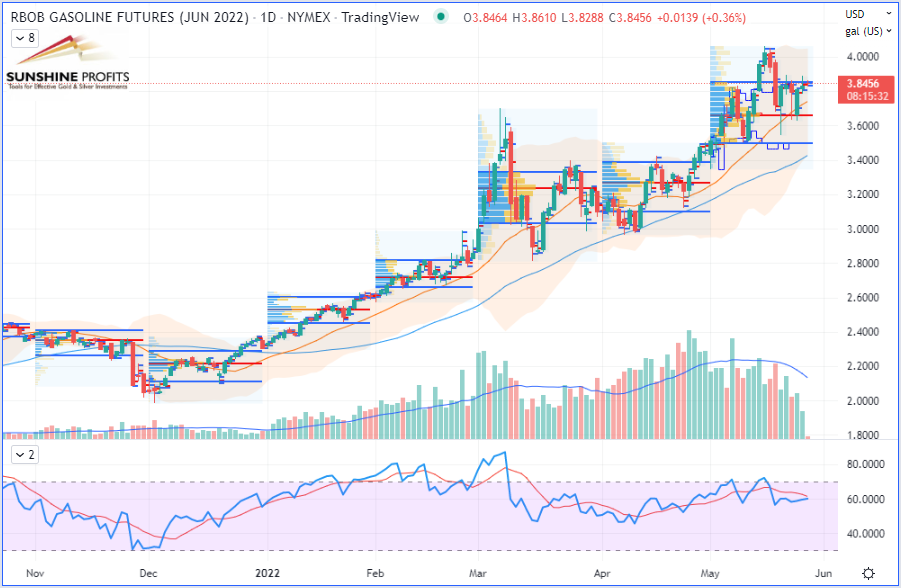
RBOB Gasoline (RBM22) Futures (June contract, daily chart)
On the Eastern side of Europe, Russian oil production shows an extraordinary ability to adapt to tougher economic conditions – in particular, Russia's economy withstanding sanctions – including the emergence of China and India as key buyers of Russian crude, in part due to the appealing discounts they are offered. After all, it is not Black (Gold) Friday every day!
Disclaimer: All essays, research and information found in this article represent the analyses and opinions of Sunshine Profits' associates only. As such, it may prove wrong and be ...
more

