Published
1 year ago on
May 27, 2022
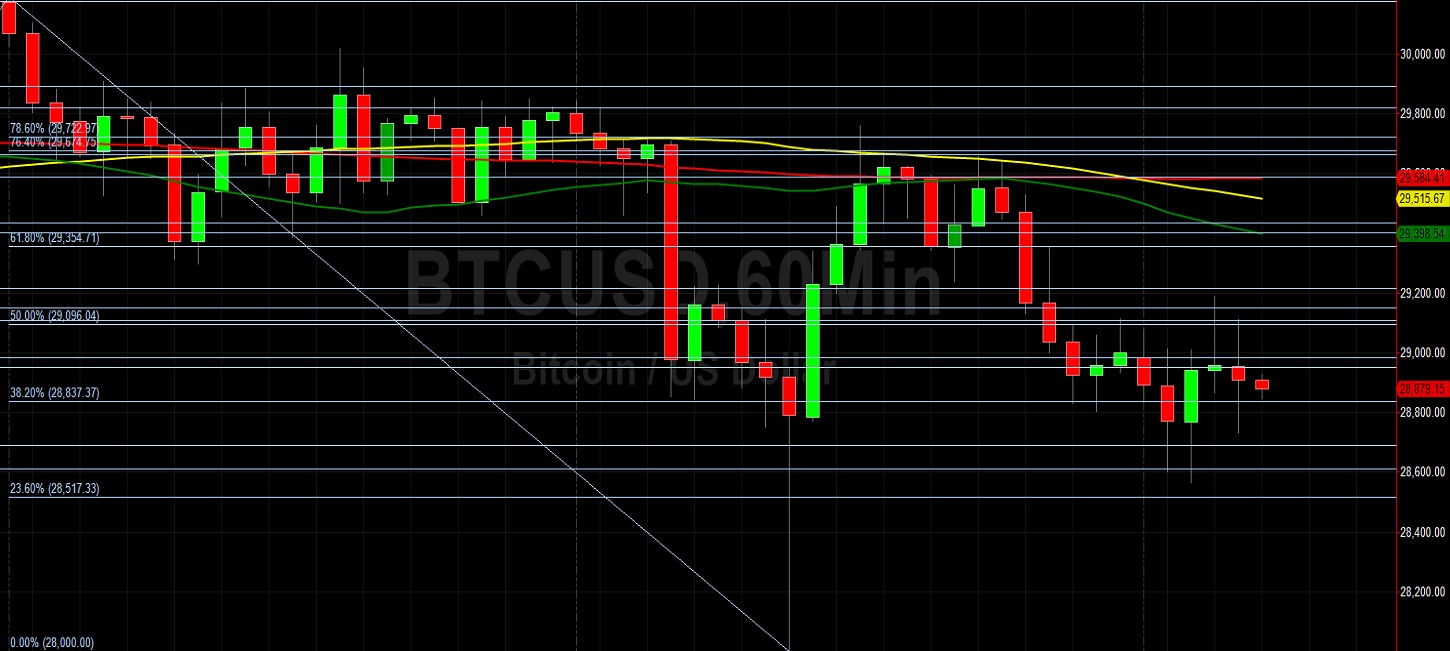
Bitcoin (BTC/USD) continued to gradually weaken early in the Asian session as the pair again traded below the psychologically-important 30000 figure and traded as low as the 28000 figure, representing a test of the 76.4% retracement of the appreciating range from 17580 to 61788.45. The recent move to relative lows opened up possible tests of additional short-term technical support around the 27661, 26773, and 26639 levels. Traders observe that the recent low around the 25338.53 area represented a test of the 23.6% retracement of a historical appreciating range from the 15708.24 level to the 28387 area, and was also above the 24365.11 area, a downside price objective related to selling pressure that emerged around the 48240 area.
Stops have been elected below many downside price objectives during the ongoing weakness, including the 30435, 29645, 28927, and 28426 areas, downside price objectives related to selling pressure that intensified around the 47469, 47200, and 48240 areas. If BTC/USD continues to depreciate, traders are eyeing additional downside price objectives around the 25142, 24365, and 21074 areas. Significant selling pressure hastened around the 31717, 31364, and 31289 areas, upside technical price objectives and retracement levels related to historical buying pressure around the 3858 area. Traders are observing that the 50-bar MA (4-hourly) is bearishly indicating below the 100-bar MA (4-hourly) and below the 200-bar MA (4-hourly). Also, the 50-bar MA (hourly) is bearishly indicating below the 100-bar MA (hourly) and below the 200-bar MA (hourly).
Price activity is nearest the 50-bar MA (4-hourly) at 29578.37 and the 50-bar MA (Hourly) at 29398.07.
Technical Support is expected around 24365.11/ 21074.87/ 20495.33 with Stops expected below.
Technical Resistance is expected around 40100.93/ 41570.88/ 43443.32 with Stops expected above.
On 4-Hourly chart, SlowK is Bearishly below SlowD while MACD is Bearishly below MACDAverage.
On 60-minute chart, SlowK is Bullishly above SlowD while MACD is Bearishly below MACDAverage.
Disclaimer: This trading analysis is provided by a third party, and for informational purposes only. It does not reflect the views of Crypto Daily, nor is it intended to be used as legal, tax, investment, or financial advice.
Investment DisclaimerStacks (STX) and Microstrategy (MSTR) are excellent bitcoin (BTC) leverage plays
Bitcoin bearish sentiment rules the market - buy more?