
Retail investors remain in shock, as most had predicted the start of another Bitcoin (BTC) recovery rally, without a forecast of possibly much more pain. The losses this year already have, in some ways, a historic character as the overall crypto market seems to end this week in the red again… for the eighth consecutive week. BTC is in its 7th negative week as markets remain shaky but might also see bargain buying at one point. As the price continues to shrink, BTC/USD fell to $28,000 after the bulls’ rout of the prior day. Bitcoin’s move beyond local extremes of $31,500 and $28,000 would be deemed a formal breakup as Bitcoin seeks to end consolidation. At the time of analysis, BTC/USD continues to gradually weaken below the psychologically-important $30,000 and traded as low as the $28,220. Per IntoTheBlock data, Bitcoin appears to have lost its support floor between $30,000 and $29,100 as there aren’t any other significant demand walls underneath BTC below $28,000.
Key Levels
Resistance Levels: $36,000, $33,000, $30,000
Support Levels: $28,000, $25,000, $22,000
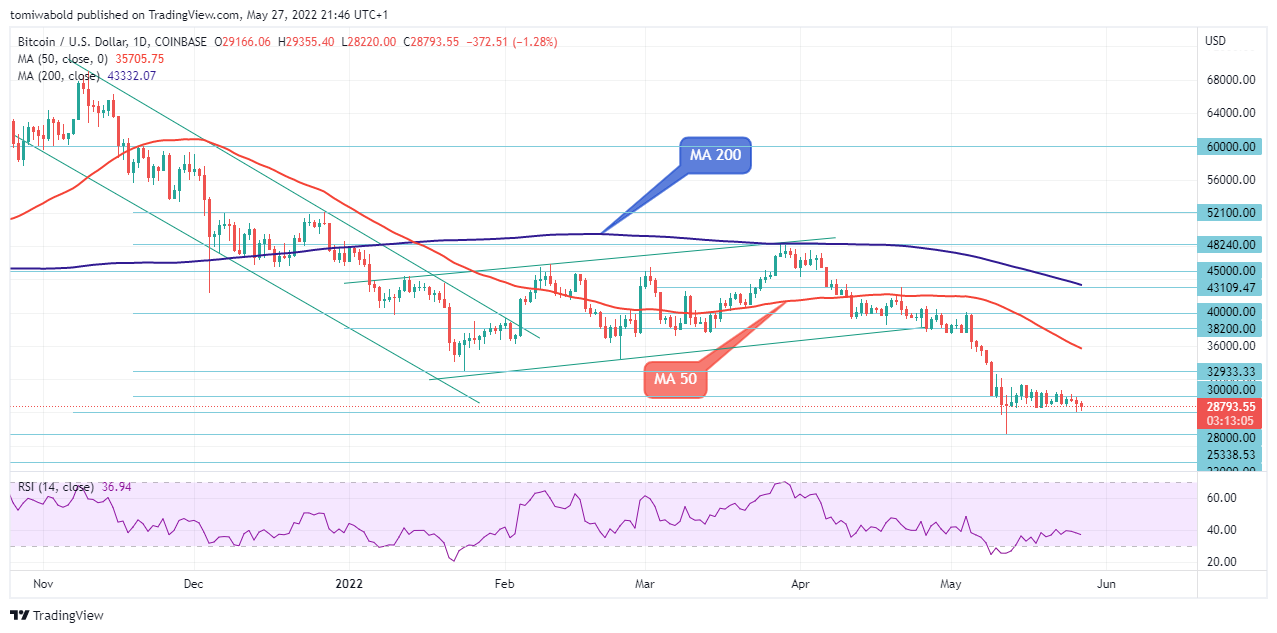 BTC/USD Daily Chart
BTC/USD is retreating from the psychological $30,000 level, continuing down at the convergence level of $29,000, indicating a strong price trend. The pair has retreated into the vicinity of a trading range that had been in place for over 21 days. On the daily chart, the near-term oscillators are reflecting the increase in bearish momentum.
The relative strength index (RSI) is in the negative zone and the price moved below the moving average (MA 50). Furthermore, the RSI’s renewed negative charge is pushing further downward price action in the pair. On the downside, sellers may find it difficult to breach an initial strengthened support level at $28,000, so a rebound higher is not ruled out.
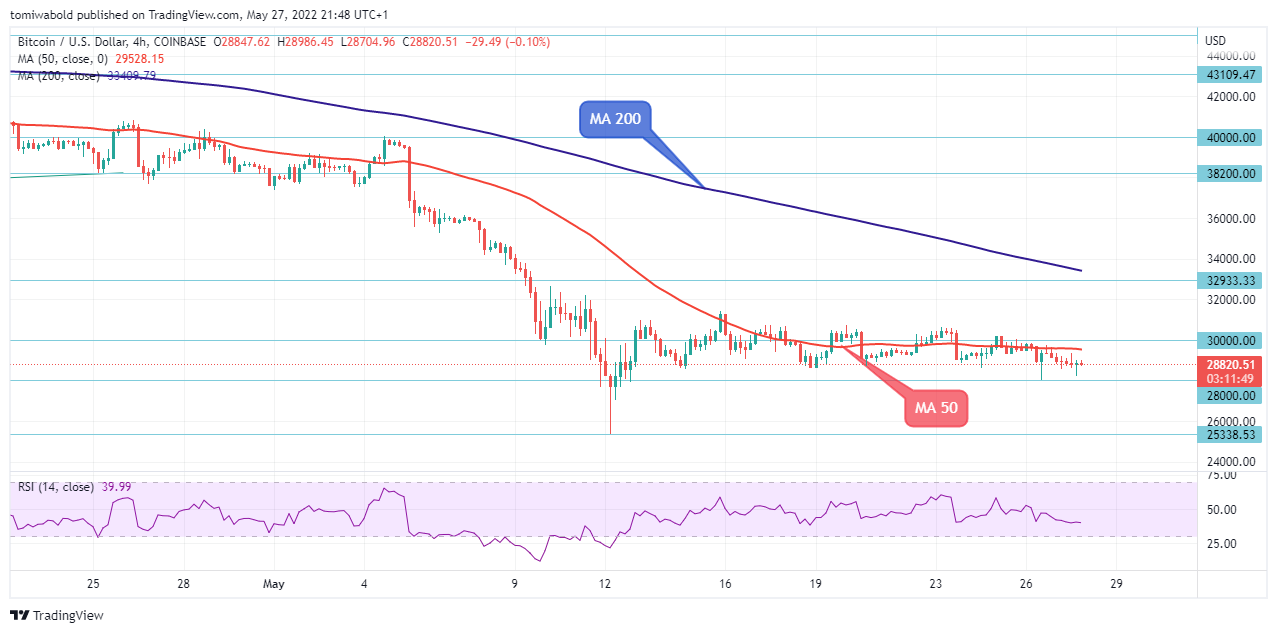 BTC/USD 4-Hour Chart
After plummeting below the $40,000 psychological zone in early May, BTC/USD has been consolidating for a long time on the lower time frame. However, the pair has found its footing and is currently trading sideways, with short-term risks pointing in that direction. Bearish moves, on the other hand, might bring the price below the critical $28,000 level.
A cautiously neutral tone is supported by the momentum indicators. Following a rally, the 4-hour moving average (MA 50) is sloping sideways, while the relative strength index (RSI) may attempt to pass above the 50-neutral threshold. Initial resistance could be found near the $30,000 psychological level if buying pressure returns to BTC/USD.
Note: Kryptomoney.com is not a financial advisor. Do your research before investing your funds in any financial asset or presented product or event. We are not responsible for your investing results
Image Credit: Shutterstock


Keep in mind that we may receive commissions when you click our links and make purchases. However, this does not impact our reviews and comparisons. We try our best to keep things fair and balanced, in order to help you make the best choice for you.
