Join Our Telegram channel to stay up to date on breaking news coverage
Litecoin Shows Recovery Signs – June 19
The present trading situation of the LTC/USD market operation reveals the crypto’s price shows recovery signs, having fallen to around lower-trading support at $45 recently. The trade has been tangibly striving to push northward back as it trades around a high point at $55, keeping positives of 17.52% as of this analytics writing.
Litecoin (LTC) Statistics:
LTC price now – $55.13
LTC market cap – $3.9 billion
LTC circulating supply – 70.5 million
LTC total supply – 84 million
Coinmarketcap ranking – #18
LTC Trade
Key Levels:
Resistance levels: $65, $75, $85
Support levels: $45, $35, $25 LTC/USD – Daily Chart
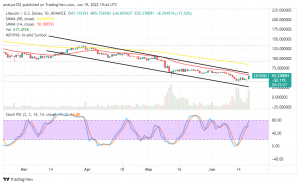
The daily chart reveals the LTC/USD market shows recovery signs after maintaining a downward-trending motion to the tune of about $45 or close above the lower bearish channel trend line. The bearish trend line drew southward tightly over the smaller SMA. The 50-day SMA indicator is above the 14-day SMA indicator. The Stochastic Oscillators have traveled northbound from the depth of an oversold region to approach a high range of 80.
su_button url=”https://insidebitcoins.com/visit/etoro-news” style=”3d” background=”#1d44bb” size=”8″ center=”yes” radius=”0″]Buy Litcoin Now[/su_button]
Will the LTC/USD market encounter rejection in its recovery signs soon?
Likely, the LTC/USD market may encounter a rejection around $65 and $75 resistant-trading points soon as it has had recovery signs presently. Buyers may ride along the current bullish trading candlestick to break through some resistances, provided its bottom doesn’t eventually get reversed against the downside in the near time. The value point to that effect is around the $45 support level.
On the downside of the technical analysis, the LTC/USD market bears may prepare to reposition at a high point not above the $85 resistance level at the highest rate before pushing the market back in the downward direction. Sellers are to exercise a great deal of caution before a decent selling entry can obtain probably the 14-day SMA indicator at the $58 if there’ll be a timely-correctional motion in the near session.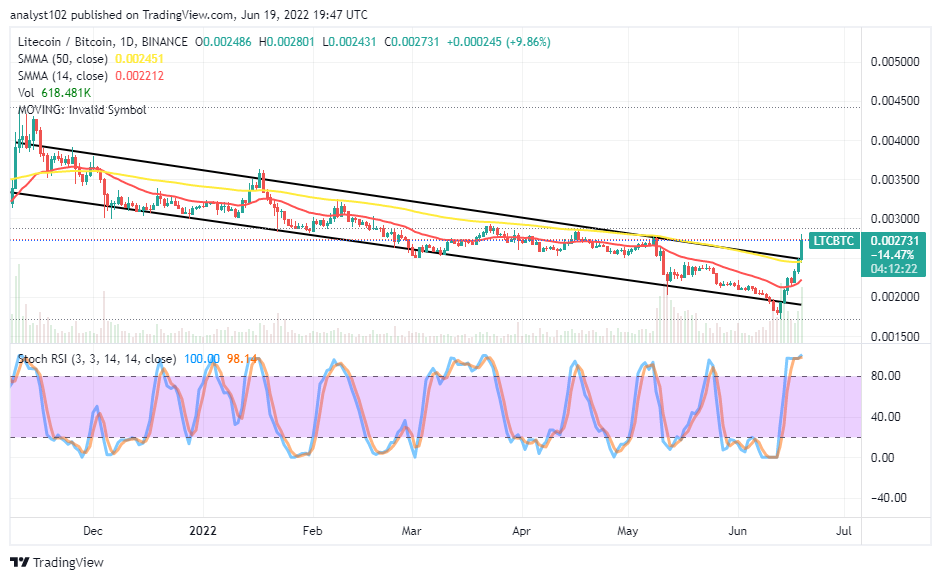
LTC/BTC Price Analysis
In comparison, Litecoin’s trending ability has been on an increasing mode against Bitcoin. The current LTC/BTC price analysis chart shows recovery signs by the base trading crypto, pairing with its counter crypto. The upper bearish trend line is alongside the 50-day SMA indicator above the 14-day SMA indicator. The 14-day SMA trend line is underneath the 50-day SMA trend line. The Stochastic Oscillators are in the overbought region with their conjoined within. Today’s bullish candlestick emerges, bottoming on top of the bigger SMA. A downward reversal against it will signal that the LTC trade may lose its momentum back to the flagship countering crypto in the long run.
Looking to buy or trade Litcoin (LTC) now? Invest at eToro!
68% of retail investor accounts lose money when trading CFDs with this provider.
Read more:
Join Our Telegram channel to stay up to date on breaking news coverage