Published
1 year ago on
June 24, 2022
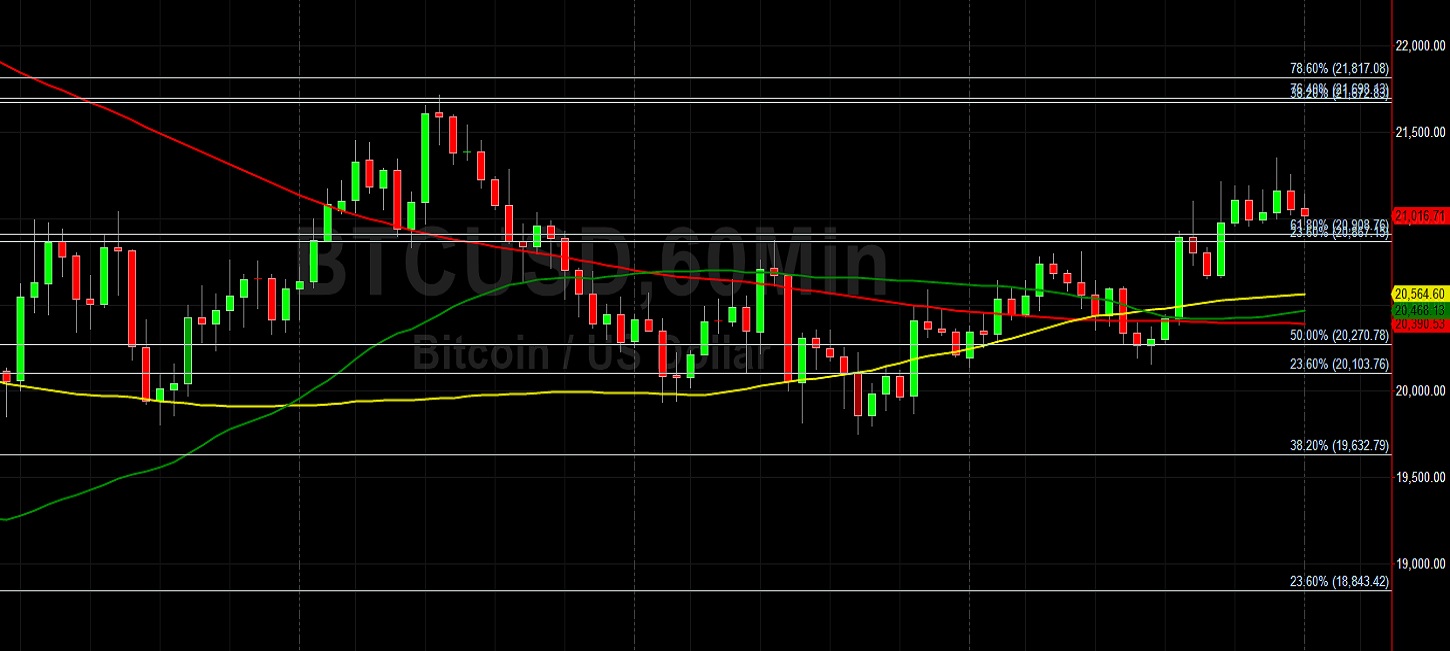
Bitcoin (BTC/USD) added to its ongoing modest appreciation from multi-month lows early in the Asian session as the pair orbited the 21000 figure after trading as high as the 21349.44 area. The recent move lower to the 19751 area represented a test of the 38.2% retracement of the depreciating range from 22974.10 to 17567.45. The recent temporary move back above the 21500 area represented a test of the 76.4% retracement of the depreciating range from 22974.10 to 17567.45. Traders continue to wait and see if BTC/USD can sustain a move above the 20867.15 area, representing the 23.6% retracement of the depreciating range from 31549.21 to 17567.45. Stops were also recently elected below the 20195.33 area during the recent depreciation, a downside price objective related to selling pressure that intensified around the 52100 area.
If BTC/USD extends its ongoing pullback, additional downside price objectives include the 16990, 15502, and 14500 areas. BTC/USD has now depreciated more than 35% from the beginning of the month through its month-to-date technical trough, and the pair has now slumped more than 57% year-to-date and more than 68% from its all-time high. Technical resistance levels and areas of potential selling pressure include the 22908, 24558, 26208, 28249, and 28557 areas. Stronger technical resistance is evident around the 27288 area, with Stops likely in place above this area. Traders are observing that the 50-bar MA (4-hourly) is bearishly indicating below the 100-bar MA (4-hourly) and below the 200-bar MA (4-hourly). Also, the 50-bar MA (hourly) is bearishly indicating below the 100-bar MA (hourly) and above the 200-bar MA (hourly).
Price activity is nearest the 50-bar MA (4-hourly) at 20341.52 and the 100-bar MA (Hourly) at 20564.53.
Technical Support is expected around 16990.14/ 14500.15/ 10432.73 with Stops expected below.
Technical Resistance is expected around 24365.11/ 27455.20/ 32383.96 with Stops expected above.
On 4-Hourly chart, SlowK is Bullishly above SlowD while MACD is Bullishly above MACDAverage.
On 60-minute chart, SlowK is Bearishly below SlowD while MACD is Bullishly above MACDAverage.
Disclaimer: This trading analysis is provided by a third party, and for informational purposes only. It does not reflect the views of Crypto Daily, nor is it intended to be used as legal, tax, investment, or financial advice.
Investment DisclaimerBitcoin bounces - Middle East tensions may now ease
Stacks (STX) and Microstrategy (MSTR) are excellent bitcoin (BTC) leverage plays