
COT Week 25 Charts: Metals Speculator Bets Slightly Higher As Gold & Silver Bets Gain

Here are the latest charts and statistics for the Commitment of Traders (COT) data published by the Commodities Futures Trading Commission (CFTC).
The latest COT data is updated through Tuesday, June 21st and shows a quick view of how large traders (for-profit speculators and commercial entities) were positioned in the futures markets.
COT metals market speculator bets were mostly higher for the week as three out of the five metals markets we cover had higher positioning this week while two markets had lower contracts.
Leading the gains for the precious metals markets was Gold (8,689 contracts) and Silver (4,414 contracts) with Palladium (11 contracts) also showing a small positive week. Meanwhile, leading the declines in speculator bets this week was Copper (-7,141 contracts) while Platinum (-723 contracts) also registered lower bets on the week.
Notes:
Highlighting the data for metals this week is the Gold positioning. Gold speculative positions rebounded a bit this week after seeing a sharp decline last week of over -20,000 contracts. The Gold net position has been mostly on the defensive since March 8th when the spec level had reached a total of +274,388 contracts which was a 61-week high, dating back to January 5th of 2021. Since then, the overall bullish position has shed a total of -111,101 contracts to settle at this week’s net standing of +163,287 contracts (just 4.4 percent level of its 3-year range). The Gold futures price, however, remains in an uptrend on the daily charts and is sitting right on a significant upward trendline that started in March of 2021.
Silver positioning, much like Gold’s, has been under pressure over the past fifteen weeks. On March 8th, Silver bets reached a forty-three week high at +52,297 contracts, coinciding with the Silver futures price hitting a 2022 high of $27.49. Since then, speculator bets have cooled and have fallen in ten out of the past fifteen weeks (and by a total of -33,878 contracts) to this week’s standing of just +18,419 contracts. The Silver futures price has been on a downtrend since April, currently trading at just over $21.00 and possibly on its way towards the significant psychological level of $20.00.
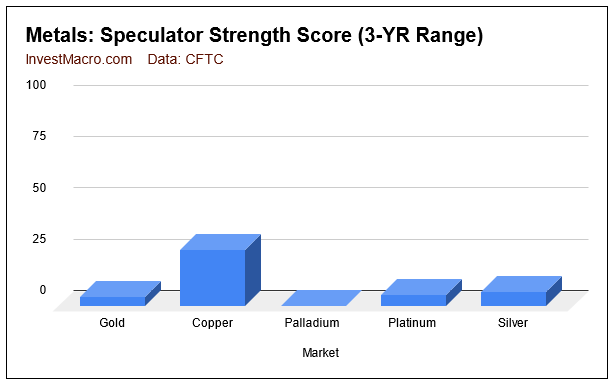
Strength scores (3-Year range of Speculator positions, from 0 to 100 where above 80 is extreme bullish and below 20 is extreme bearish) show that Copper (27 percent) remains the only precious metals futures market that is not in an extreme bearish level (below 20 percent). A rising interest rate environment with a strong US Dollar has weighed on the precious metals category as speculator futures sentiment continues to be really weak at the moment.
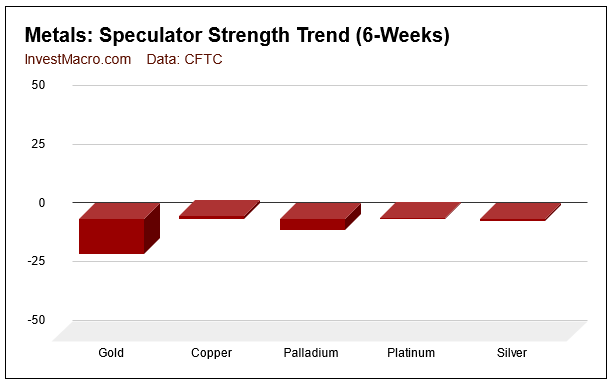
Strength score trends (or move index, that calculate 6-week changes in strength scores) shows that Gold (-15.1 percent) and Palladium (-4.5 percent) lead the downward trends over the past six weeks. Copper (1.2 percent) and Platinum (0.2 percent) are the only two markets with positive trends over the time period.
Data Snapshot of Commodity Market Traders | Columns Legend
| WTI Crude | 1,658,636 | 0 | 289,502 | 0 | -323,915 | 100 | 34,413 | 64 |
| Corn | 1,512,152 | 23 | 380,169 | 79 | -326,474 | 25 | -53,695 | 12 |
| Natural Gas | 1,030,971 | 0 | -130,869 | 39 | 85,977 | 58 | 44,892 | 86 |
| Sugar | 779,773 | 0 | 163,111 | 70 | -181,280 | 34 | 18,169 | 30 |
| Soybeans | 745,494 | 32 | 178,379 | 68 | -152,968 | 38 | -25,411 | 28 |
| Gold | 500,276 | 14 | 163,287 | 4 | -186,929 | 96 | 23,642 | 14 |
| Wheat | 320,326 | 6 | 19,067 | 44 | -15,407 | 38 | -3,660 | 91 |
| Heating Oil | 268,818 | 23 | 9,564 | 56 | -28,204 | 41 | 18,640 | 63 |
| Coffee | 192,832 | 0 | 49,371 | 81 | -52,348 | 22 | 2,977 | 20 |
| Copper | 187,170 | 17 | -20,938 | 27 | 18,928 | 72 | 2,010 | 37 |
| Brent | 173,098 | 18 | -38,010 | 47 | 36,052 | 53 | 1,958 | 36 |
| Silver | 145,356 | 12 | 18,419 | 7 | -27,250 | 93 | 8,831 | 4 |
| Platinum | 64,946 | 30 | 1,491 | 6 | -6,397 | 96 | 4,906 | 30 |
| Palladium | 7,641 | 6 | -4,046 | 0 | 4,511 | 100 | -465 | 17 |
Gold Comex Futures:
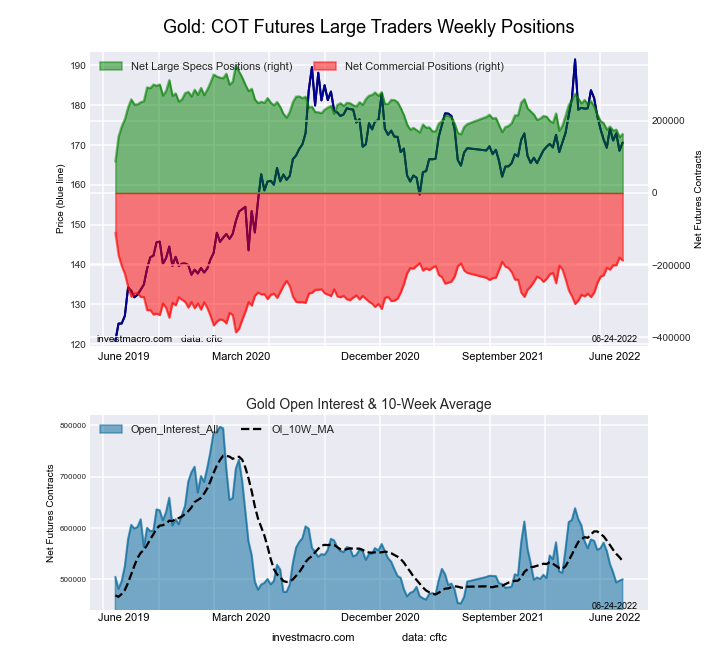
The Gold Comex Futures large speculator standing this week came in at a net position of 163,287 contracts in the data reported through Tuesday. This was a weekly rise of 8,689 contracts from the previous week which had a total of 154,598 net contracts.
This week’s current strength score (the trader positioning range over the past three years, measured from 0 to 100) shows the speculators are currently Bearish-Extreme with a score of 4.4 percent. The commercials are Bullish-Extreme with a score of 96.0 percent and the small traders (not shown in chart) are Bearish-Extreme with a score of 13.7 percent.
| Gold Futures Statistics | SPECULATORS | COMMERCIALS | SMALL TRADERS |
| – Percent of Open Interest Longs: | 53.6 | 24.0 | 8.9 |
| – Percent of Open Interest Shorts: | 21.0 | 61.4 | 4.1 |
| – Net Position: | 163,287 | -186,929 | 23,642 |
| – Gross Longs: | 268,119 | 120,045 | 44,380 |
| – Gross Shorts: | 104,832 | 306,974 | 20,738 |
| – Long to Short Ratio: | 2.6 to 1 | 0.4 to 1 | 2.1 to 1 |
| NET POSITION TREND: | |||
| – Strength Index Score (3 Year Range Pct): | 4.4 | 96.0 | 13.7 |
| – Strength Index Reading (3 Year Range): | Bearish-Extreme | Bullish-Extreme | Bearish-Extreme |
| NET POSITION MOVEMENT INDEX: | |||
| – 6-Week Change in Strength Index: | -15.1 | 19.7 | -38.5 |
Silver Comex Futures:
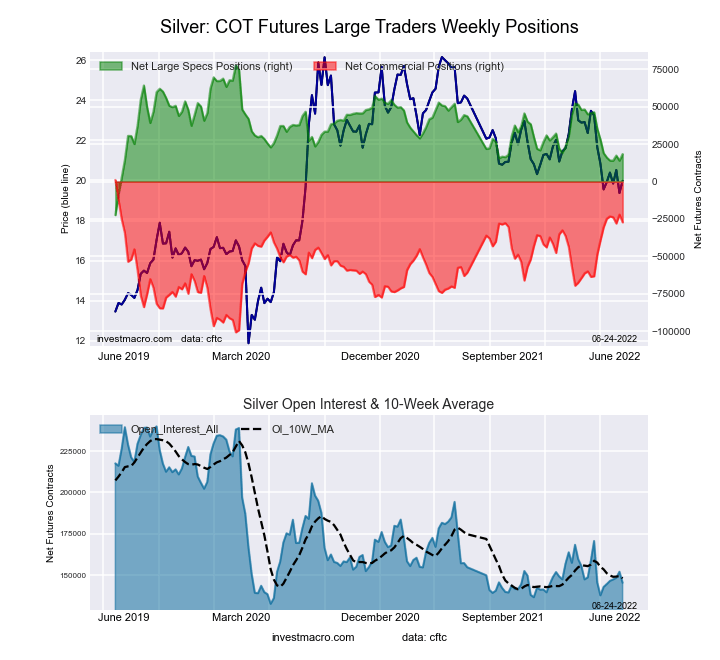
The Silver Comex Futures large speculator standing this week came in at a net position of 18,419 contracts in the data reported through Tuesday. This was a weekly increase of 4,414 contracts from the previous week which had a total of 14,005 net contracts.
This week’s current strength score (the trader positioning range over the past three years, measured from 0 to 100) shows the speculators are currently Bearish-Extreme with a score of 6.9 percent. The commercials are Bullish-Extreme with a score of 93.4 percent and the small traders (not shown in chart) are Bearish-Extreme with a score of 4.2 percent.
| Silver Futures Statistics | SPECULATORS | COMMERCIALS | SMALL TRADERS |
| – Percent of Open Interest Longs: | 37.5 | 37.7 | 17.2 |
| – Percent of Open Interest Shorts: | 24.8 | 56.5 | 11.1 |
| – Net Position: | 18,419 | -27,250 | 8,831 |
| – Gross Longs: | 54,451 | 54,828 | 25,018 |
| – Gross Shorts: | 36,032 | 82,078 | 16,187 |
| – Long to Short Ratio: | 1.5 to 1 | 0.7 to 1 | 1.5 to 1 |
| NET POSITION TREND: | |||
| – Strength Index Score (3 Year Range Pct): | 6.9 | 93.4 | 4.2 |
| – Strength Index Reading (3 Year Range): | Bearish-Extreme | Bullish-Extreme | Bearish-Extreme |
| NET POSITION MOVEMENT INDEX: | |||
| – 6-Week Change in Strength Index: | -1.0 | 4.2 | -13.8 |
Copper Grade #1 Futures:
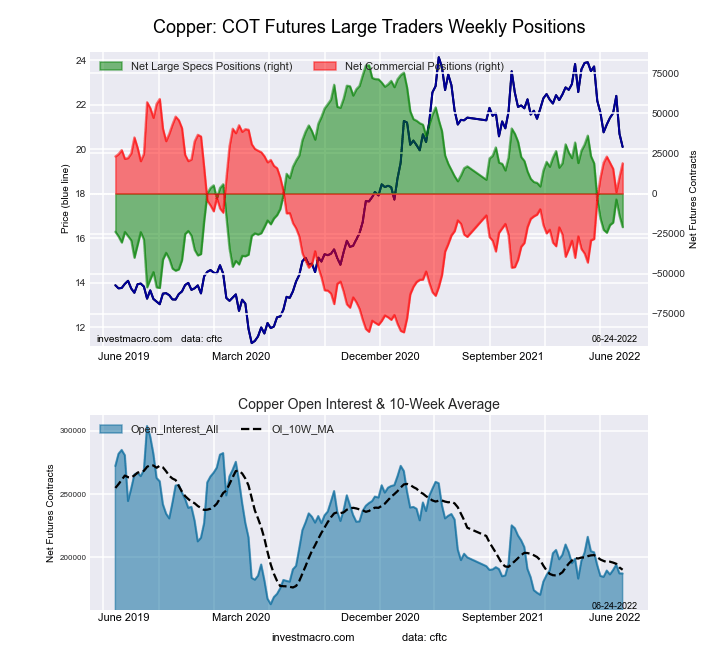
The Copper Grade #1 Futures large speculator standing this week came in at a net position of -20,938 contracts in the data reported through Tuesday. This was a weekly decline of -7,141 contracts from the previous week which had a total of -13,797 net contracts.
This week’s current strength score (the trader positioning range over the past three years, measured from 0 to 100) shows the speculators are currently Bearish with a score of 27.3 percent. The commercials are Bullish with a score of 72.5 percent and the small traders (not shown in chart) are Bearish with a score of 36.9 percent.
| Copper Futures Statistics | SPECULATORS | COMMERCIALS | SMALL TRADERS |
| – Percent of Open Interest Longs: | 26.8 | 55.5 | 9.0 |
| – Percent of Open Interest Shorts: | 38.0 | 45.3 | 8.0 |
| – Net Position: | -20,938 | 18,928 | 2,010 |
| – Gross Longs: | 50,230 | 103,789 | 16,909 |
| – Gross Shorts: | 71,168 | 84,861 | 14,899 |
| – Long to Short Ratio: | 0.7 to 1 | 1.2 to 1 | 1.1 to 1 |
| NET POSITION TREND: | |||
| – Strength Index Score (3 Year Range Pct): | 27.3 | 72.5 | 36.9 |
| – Strength Index Reading (3 Year Range): | Bearish | Bullish | Bearish |
| NET POSITION MOVEMENT INDEX: | |||
| – 6-Week Change in Strength Index: | 1.2 | -0.2 | -7.9 |
Platinum Futures:
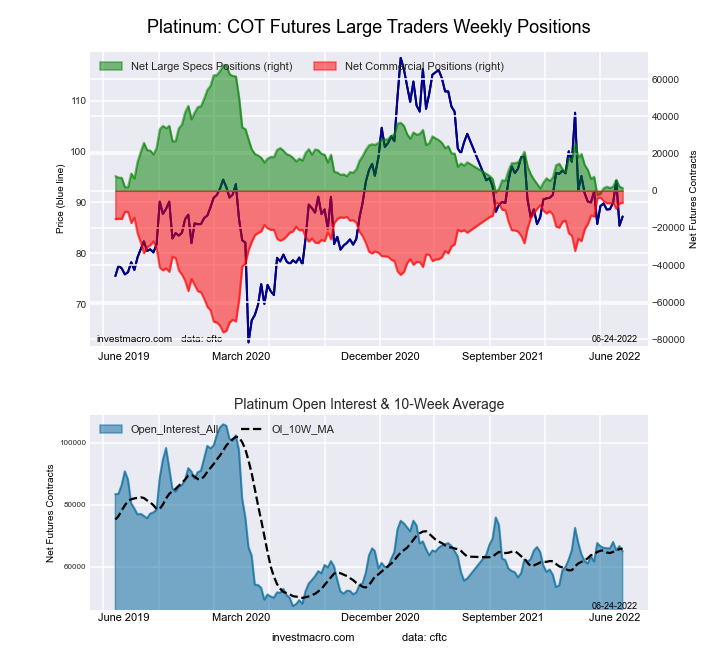
The Platinum Futures large speculator standing this week came in at a net position of 1,491 contracts in the data reported through Tuesday. This was a weekly fall of -723 contracts from the previous week which had a total of 2,214 net contracts.
This week’s current strength score (the trader positioning range over the past three years, measured from 0 to 100) shows the speculators are currently Bearish-Extreme with a score of 5.5 percent. The commercials are Bullish-Extreme with a score of 96.2 percent and the small traders (not shown in chart) are Bearish with a score of 30.4 percent.
| Platinum Futures Statistics | SPECULATORS | COMMERCIALS | SMALL TRADERS |
| – Percent of Open Interest Longs: | 39.5 | 43.9 | 13.0 |
| – Percent of Open Interest Shorts: | 37.2 | 53.7 | 5.4 |
| – Net Position: | 1,491 | -6,397 | 4,906 |
| – Gross Longs: | 25,676 | 28,487 | 8,413 |
| – Gross Shorts: | 24,185 | 34,884 | 3,507 |
| – Long to Short Ratio: | 1.1 to 1 | 0.8 to 1 | 2.4 to 1 |
| NET POSITION TREND: | |||
| – Strength Index Score (3 Year Range Pct): | 5.5 | 96.2 | 30.4 |
| – Strength Index Reading (3 Year Range): | Bearish-Extreme | Bullish-Extreme | Bearish |
| NET POSITION MOVEMENT INDEX: | |||
| – 6-Week Change in Strength Index: | 0.2 | -1.4 | 12.5 |
Palladium Futures:
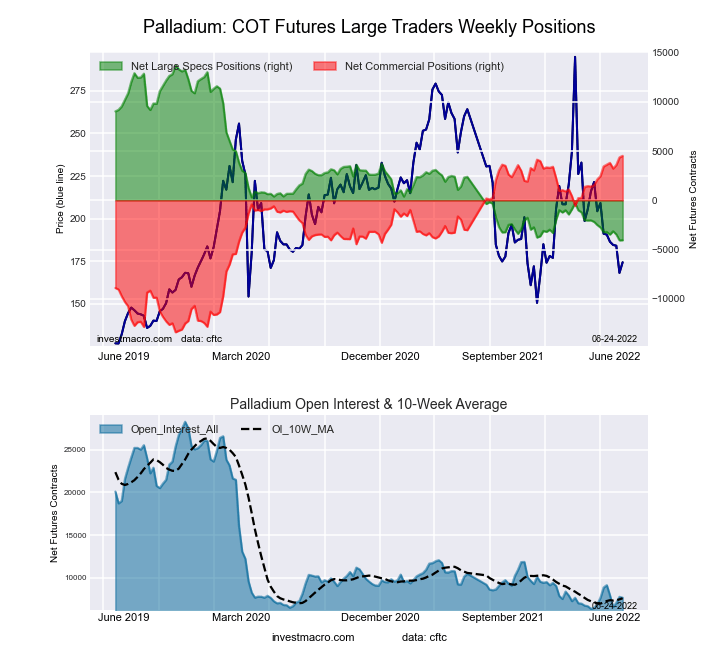
The Palladium Futures large speculator standing this week came in at a net position of -4,046 contracts in the data reported through Tuesday. This was a weekly lift of 11 contracts from the previous week which had a total of -4,057 net contracts.
This week’s current strength score (the trader positioning range over the past three years, measured from 0 to 100) shows the speculators are currently Bearish-Extreme with a score of 0.1 percent. The commercials are Bullish-Extreme with a score of 100.0 percent and the small traders (not shown in chart) are Bearish-Extreme with a score of 17.0 percent.
| Palladium Futures Statistics | SPECULATORS | COMMERCIALS | SMALL TRADERS |
| – Percent of Open Interest Longs: | 13.2 | 74.0 | 12.6 |
| – Percent of Open Interest Shorts: | 66.2 | 15.0 | 18.6 |
| – Net Position: | -4,046 | 4,511 | -465 |
| – Gross Longs: | 1,009 | 5,655 | 960 |
| – Gross Shorts: | 5,055 | 1,144 | 1,425 |
| – Long to Short Ratio: | 0.2 to 1 | 4.9 to 1 | 0.7 to 1 |
| NET POSITION TREND: | |||
| – Strength Index Score (3 Year Range Pct): | 0.1 | 100.0 | 17.0 |
| – Strength Index Reading (3 Year Range): | Bearish-Extreme | Bullish-Extreme | Bearish-Extreme |
| NET POSITION MOVEMENT INDEX: | |||
| – 6-Week Change in Strength Index: | -4.5 | 6.0 | -16.0 |
*COT Report: The COT data, released weekly to the public each Friday, is updated through the most recent Tuesday (data is 3 days old) and shows a quick view of how large speculators or non-commercials (for-profit traders) were positioned in the futures markets.
The CFTC categorizes trader positions according to commercial hedgers (traders who use futures contracts for hedging as part of the business), non-commercials (large traders who speculate to realize trading profits) and nonreportable traders (usually small traders/speculators) as well as their open interest (contracts open in the market at time of reporting).See CFTC criteria here.
Disclosure: Foreign Currency trading and trading on margin carries a high level of risk and can result in loss of part or all of your investment.Due to the level of risk and market volatility, ...
more

