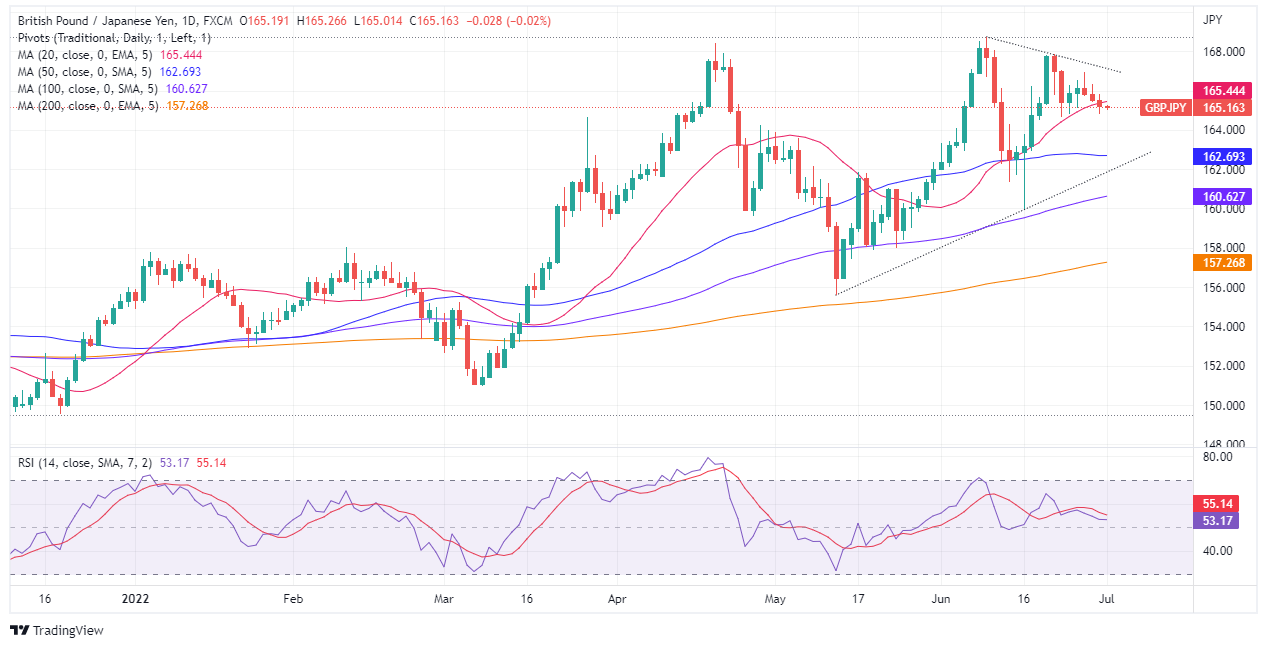
- The GBP/JPY closed in June with solid gains of almost 2%, as depicted by the weekly chart.
- From the daily chart perspective, the GBP/JPY is upward biased, but the pair tumbling below the 20-day EMA exposes the GBP/JPY to further selling pressure.
- GBP/JPY in the near term is neutral-downward biased and might accelerate its losses if sellers reclaim 164.65.
The British pound ended June with gains of almost 2% against the Japanese yen, but on the last trading day of the month, it recorded a loss of 0.19%, extending its fall to three straight days in the middle of a dampened market mood. At the time of writing, the GBP/JPY is trading at 165.24, barely up 0.04% as the Friday Asian session begins.
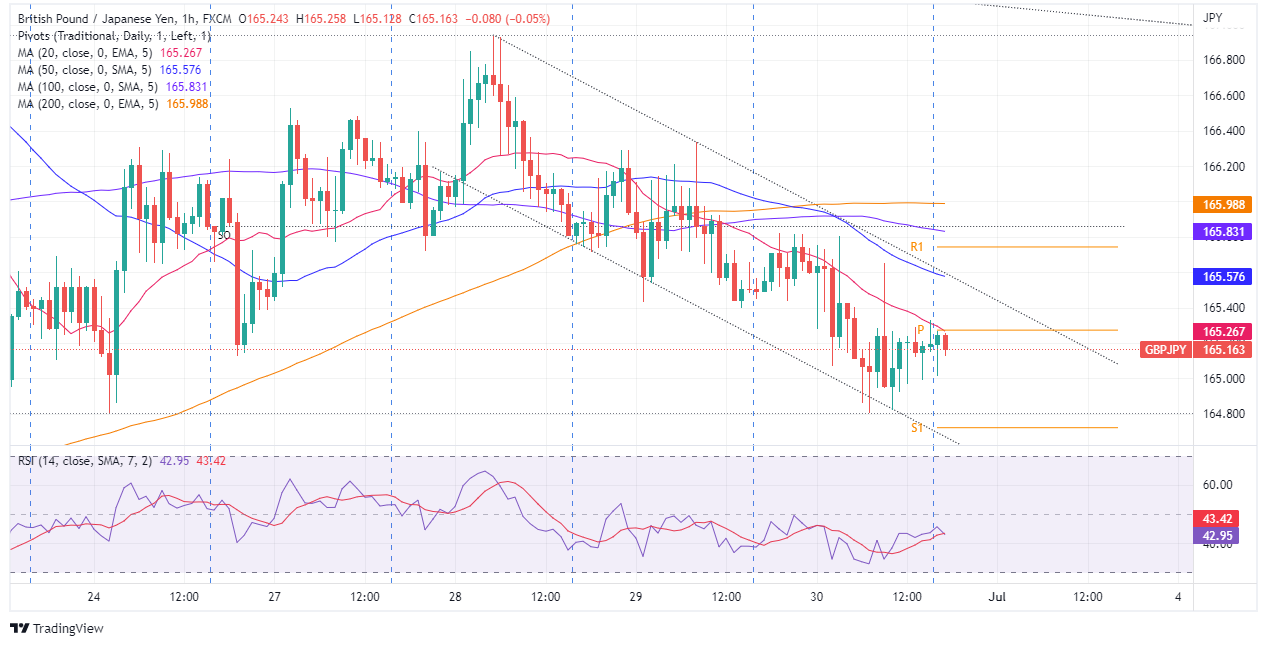
On Thursday, the GBP/JPY extended its fall, which began on June 28, when the pair reached a weekly high of around 166.94 and made a U-turn, which sent the pair tumbling towards a June 29 low at 169.39. That said, the GBP/JPY opened near the day’s highs and dropped towards the current week’s low around 164.80.
GBP/JPY Daily chart
The GBP/JPY daily chart illustrates the pair as upward biased in the long term, but a break below the 20-day EMA, at 165.44, leaves the cross-currency pair exposed to selling pressure. GBP/JPY sellers need to reclaim the June 23 daily low at 164.65 if they would like to extend the fall. If that scenario plays out, the next support would be the 50-day EMA at 162.69. Otherwise, the GBP/JPY’s first resistance would be the 20-day EMA at 165.44, followed by the June 28 high at 166.94.
GBP/JPY 1-Hour chart
In the 1-hour chart, the GBP/JPY illustrates a negative story in the short term. Since June 28, the pair fell 1.28%, more than 200-pips, courtesy of the Sterling weakness, which has bolstered the yen. In fact, price action is within a descending channel, showing the formation of a bullish flag. Nonetheless, further losses are expected if the GBP/JPY breaks below 164.65. Otherwise, the GBP/JPY first resistance would be the 20-EMA at 165.26, followed by the R1 daily pivot at 165.83, followed by the 200-EMA at1 65.98.
GBP/JPY Key Technical Level
Information on these pages contains forward-looking statements that involve risks and uncertainties. Markets and instruments profiled on this page are for informational purposes only and should not in any way come across as a recommendation to buy or sell in these assets. You should do your own thorough research before making any investment decisions. FXStreet does not in any way guarantee that this information is free from mistakes, errors, or material misstatements. It also does not guarantee that this information is of a timely nature. Investing in Open Markets involves a great deal of risk, including the loss of all or a portion of your investment, as well as emotional distress. All risks, losses and costs associated with investing, including total loss of principal, are your responsibility. The views and opinions expressed in this article are those of the authors and do not necessarily reflect the official policy or position of FXStreet nor its advertisers. The author will not be held responsible for information that is found at the end of links posted on this page.
If not otherwise explicitly mentioned in the body of the article, at the time of writing, the author has no position in any stock mentioned in this article and no business relationship with any company mentioned. The author has not received compensation for writing this article, other than from FXStreet.
FXStreet and the author do not provide personalized recommendations. The author makes no representations as to the accuracy, completeness, or suitability of this information. FXStreet and the author will not be liable for any errors, omissions or any losses, injuries or damages arising from this information and its display or use. Errors and omissions excepted.
The author and FXStreet are not registered investment advisors and nothing in this article is intended to be investment advice.
Recommended content
Editors’ Picks
EUR/USD holds above 1.0650 after US data

EUR/USD retreats from session highs but manages to hold above 1.0650 in the early American session. Upbeat macroeconomic data releases from the US helps the US Dollar find a foothold and limits the pair's upside.
GBP/USD retreats toward 1.2450 on modest USD rebound

GBP/USD edges lower in the second half of the day and trades at around 1.2450. Better-than-expected Jobless Claims and Philadelphia Fed Manufacturing Index data from the US provides a support to the USD and forces the pair to stay on the back foot.
Gold is closely monitoring geopolitics

Gold trades in positive territory above $2,380 on Thursday. Although the benchmark 10-year US Treasury bond yield holds steady following upbeat US data, XAU/USD continues to stretch higher on growing fears over a deepening conflict in the Middle East.
Ripple faces significant correction as former SEC litigator says lawsuit could make it to Supreme Court

Ripple (XRP) price hovers below the key $0.50 level on Thursday after failing at another attempt to break and close above the resistance for the fourth day in a row.
Have we seen the extent of the Fed rate repricing?

Markets have been mostly consolidating recent moves into Thursday. We’ve seen some profit taking on Dollar longs and renewed demand for US equities into the dip. Whether or not this holds up is a completely different story.