- The AUD/JPY registered gains of almost 1.50% in June.
- A rising wedge in the AUD/JPY’s daily chart targets a fall towards 86.20s.
- The AUD/JPY in the near term is neutral-downward biased.
AUD/JPY prolongs its losses amidst a risk-off impulse weighing on global equities, sending investors scrambling toward safe-haven assets; in the FX complex being the Japanese yen and the Swiss franc, except the US dollar, undermined by falling US Treasury yields. At 93.67, the AUD/JPY is almost flat as the Asian Pacific session begins.
AUD/JPY Thursday’s price action illustrates consolidation in the last few days, within the 93.40-94.30 range, which buyers/sellers have been unable to break. AUD/JPY traders should note that the cross exchange rate is below the exponential moving averages (EMAs) in the 1-hour chart, signifying that downside risks remain in the short term.
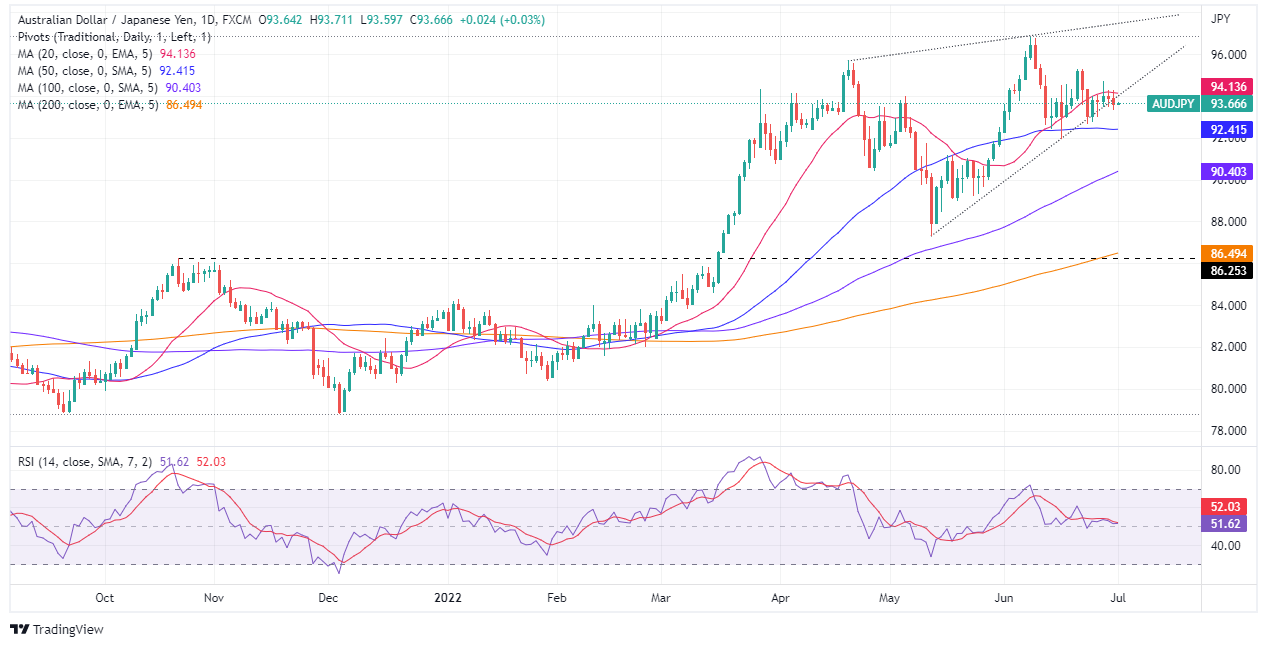
AUD/JPY Daily chart
The AUD/JPY daily chart illustrates that the uptrend remains in play. Nevertheless, the pair’s falling below the 20-day EMA leaves it vulnerable to selling pressure, but the “damage” could be limited by the 50-day EMA at 92.41, followed by the June 16 swing low at 91.96. If that scenario plays out, it will also confirm the break of a rising wedge that targets the October 21, 2021 swing high-turned-support at 86.25.
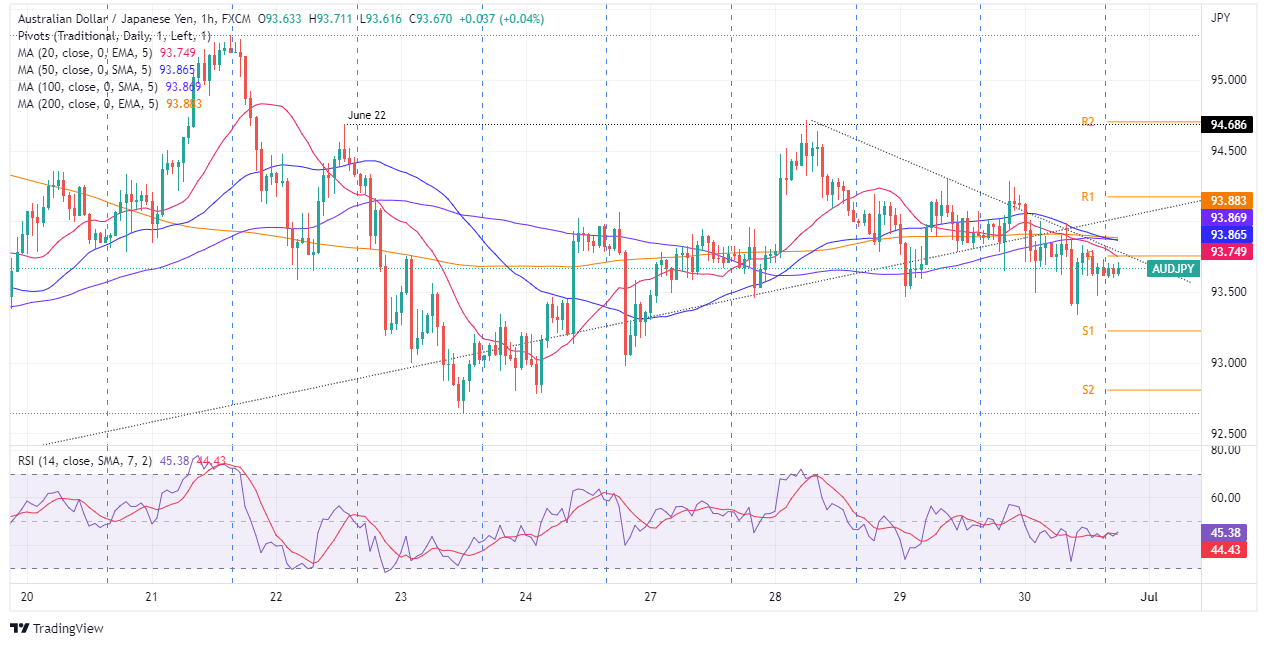
AUD/JPY 1-Hour chart
In the near term, the AUD/JPY depicts a neutral-downward bias, confirmed by the EMAs and the Relative Strenght Index (RSI), which albeit almost trendless, remains below the 50-midline, in negative territory. Furthermore, a four-times tested downslope trendline suggests the pair is consolidating.
If the AUD/JPY breaks to the downside, its first support would be the June 30 daily low at 93.33. Once cleared, it would expose the S1 daily pivot at 93.23, followed by the June 26 low at 92.97. Contrarily, if the cross heads north, the AUD/JPY’s first resistance would be the 20-EMA at 93.74. Break above would expose the confluence of the 50, 100, and 200-EMAs, in the 93.85-88 range, followed by the R1 daily pivot at 94.20, followed by the June 22 high at 94.68.
AUD/JPY Key Technical Levels
Information on these pages contains forward-looking statements that involve risks and uncertainties. Markets and instruments profiled on this page are for informational purposes only and should not in any way come across as a recommendation to buy or sell in these assets. You should do your own thorough research before making any investment decisions. FXStreet does not in any way guarantee that this information is free from mistakes, errors, or material misstatements. It also does not guarantee that this information is of a timely nature. Investing in Open Markets involves a great deal of risk, including the loss of all or a portion of your investment, as well as emotional distress. All risks, losses and costs associated with investing, including total loss of principal, are your responsibility. The views and opinions expressed in this article are those of the authors and do not necessarily reflect the official policy or position of FXStreet nor its advertisers. The author will not be held responsible for information that is found at the end of links posted on this page.
If not otherwise explicitly mentioned in the body of the article, at the time of writing, the author has no position in any stock mentioned in this article and no business relationship with any company mentioned. The author has not received compensation for writing this article, other than from FXStreet.
FXStreet and the author do not provide personalized recommendations. The author makes no representations as to the accuracy, completeness, or suitability of this information. FXStreet and the author will not be liable for any errors, omissions or any losses, injuries or damages arising from this information and its display or use. Errors and omissions excepted.
The author and FXStreet are not registered investment advisors and nothing in this article is intended to be investment advice.
Recommended content
Editors’ Picks
EUR/USD holds above 1.0700 ahead of key US data

EUR/USD trades in a tight range above 1.0700 in the early European session on Friday. The US Dollar struggles to gather strength ahead of key PCE Price Index data, the Fed's preferred gauge of inflation, and helps the pair hold its ground.
USD/JPY stays above 156.00 after BoJ Governor Ueda's comments

USD/JPY holds above 156.00 after surging above this level with the initial reaction to the Bank of Japan's decision to leave the policy settings unchanged. BoJ Governor said weak Yen was not impacting prices but added that they will watch FX developments closely.
Gold price oscillates in a range as the focus remains glued to the US PCE Price Index

Gold price struggles to attract any meaningful buyers amid the emergence of fresh USD buying. Bets that the Fed will keep rates higher for longer amid sticky inflation help revive the USD demand.
Sei Price Prediction: SEI is in the zone of interest after a 10% leap

Sei price has been in recovery mode for almost ten days now, following a fall of almost 65% beginning in mid-March. While the SEI bulls continue to show strength, the uptrend could prove premature as massive bearish sentiment hovers above the altcoin’s price.
US core PCE inflation set to signal firm price pressures as markets delay Federal Reserve rate cut bets

The core PCE Price Index, which excludes volatile food and energy prices, is seen as the more influential measure of inflation in terms of Fed positioning. The index is forecast to rise 0.3% on a monthly basis in March, matching February’s increase.