
The Ethereum (ETH) maintained its price over its recent lows after the week, as the broader cryptocurrency markets attempted to stabilize following six days of losses earlier in the week. Despite an uptick in buying activity around the $1,025 level, which was formed just above the psychological support zone of $1,000, ETH is still experiencing persistent negative threats. ETH fell back after reaching minor resistance at $1,280 and came up short of expectations. After a brief pullback, the pair found solid support above the former resistance at $1,000. A pop above the recent high ($1,280) might suggest that the bulls are back in the game. At the time of analysis, the ETH/USD price had bounced off to register a daily high at $1,077. Ethereum miners made 45.5 percent less money in June than they did the month before, as data from The Block Research shows. Ethereum mining generated $528 million in revenue, a decrease from the prior month. The primary reason for declining mining revenues can be attributed to falling cryptocurrency prices brought on by the May market crisis.
Key Levels
Resistance Levels: $1,700, $1,500, $1,300
Support Levels: $1,000, $879, $500
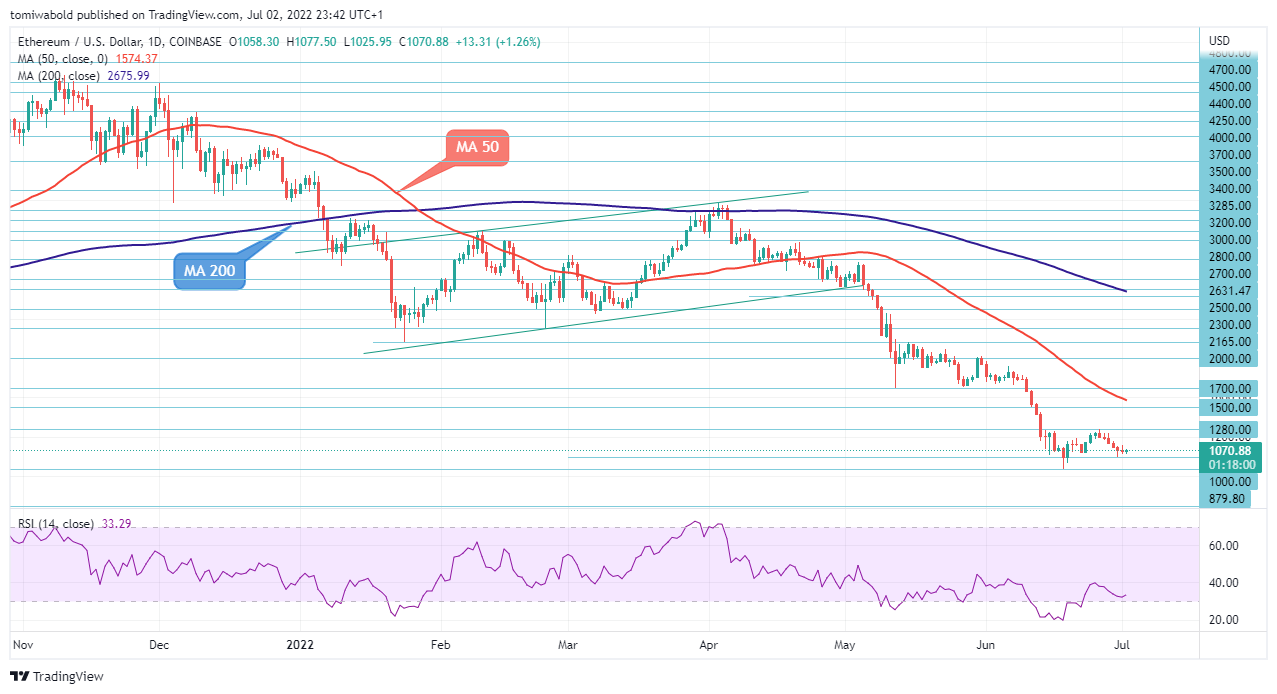 ETH/USD Daily Chart
ETH/USD increased a little from its June 30 low of $997.02. Despite the little recovery, Ethereum is still trading below the moving averages (MA 50 and MA 200) and inside a consolidation range of $879 to $1,280. The relative strength index (RSI) is emulating price movement and oscillations below the neutral 50-point line.
Given that the price is far below the daily MA 50 and 200 on the daily chart, the bears might continue to exert pressure on ETH/USD. Before anticipating a rally, the market may exhibit downside potential. Before the $879 low, ETH might find support at the $900 level. Early resistance could form from the $1,500 level.
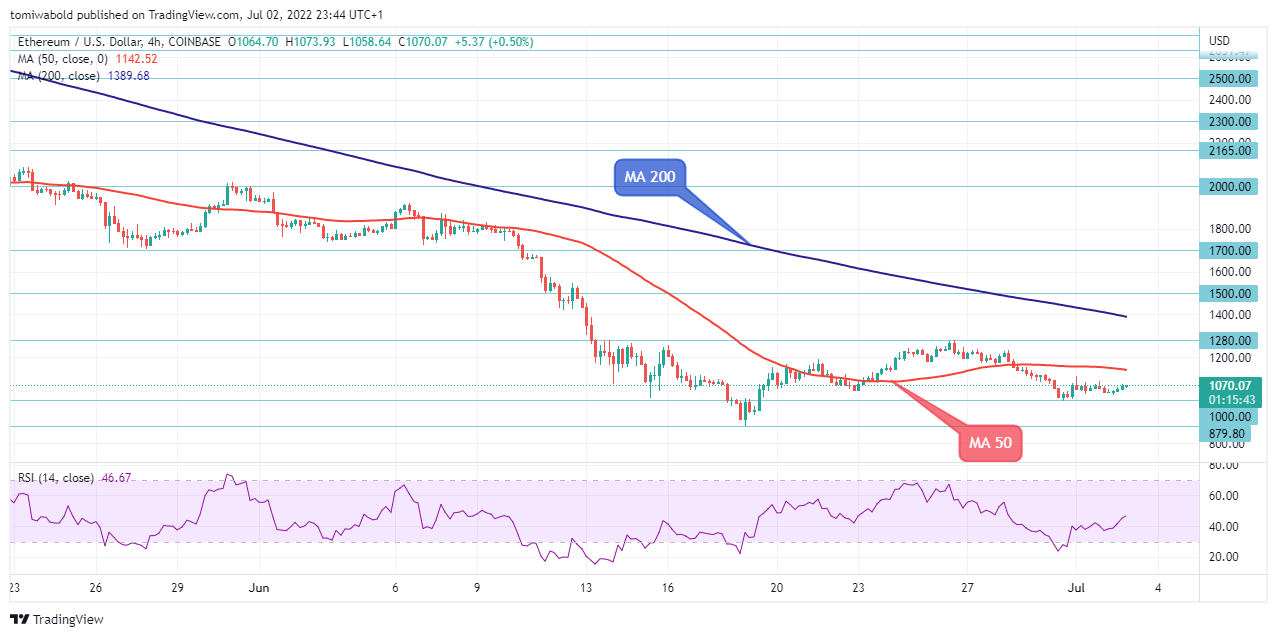 ETH/USD 4-Hour Chart
After ETH/USD stopped further declines at the $1,000 level, the pair is slowly moving sideways. The directional momentum signals being transmitted by the technical oscillators are contradicting, and the RSI appears to be moving into the bullish zone. In a favorable scenario, strong resistance might come from the $1150 level, which is the MA 50.
Overcoming this and the $1,280 resistance, the ETH/USD pair may reach the $1,700 high before attempting to surpass the $2,000 psychological zone. If not, downside restrictions could start around $1,000 and last till $879, or slightly below. Sellers may direct the price to the next support range of $700.
Note: Kryptomoney.com is not a financial advisor. Do your research before investing your funds in any financial asset or presented product or event. We are not responsible for your investing results
Image Credit: Shutterstock


Keep in mind that we may receive commissions when you click our links and make purchases. However, this does not impact our reviews and comparisons. We try our best to keep things fair and balanced, in order to help you make the best choice for you.

