Join Our Telegram channel to stay up to date on breaking news coverage
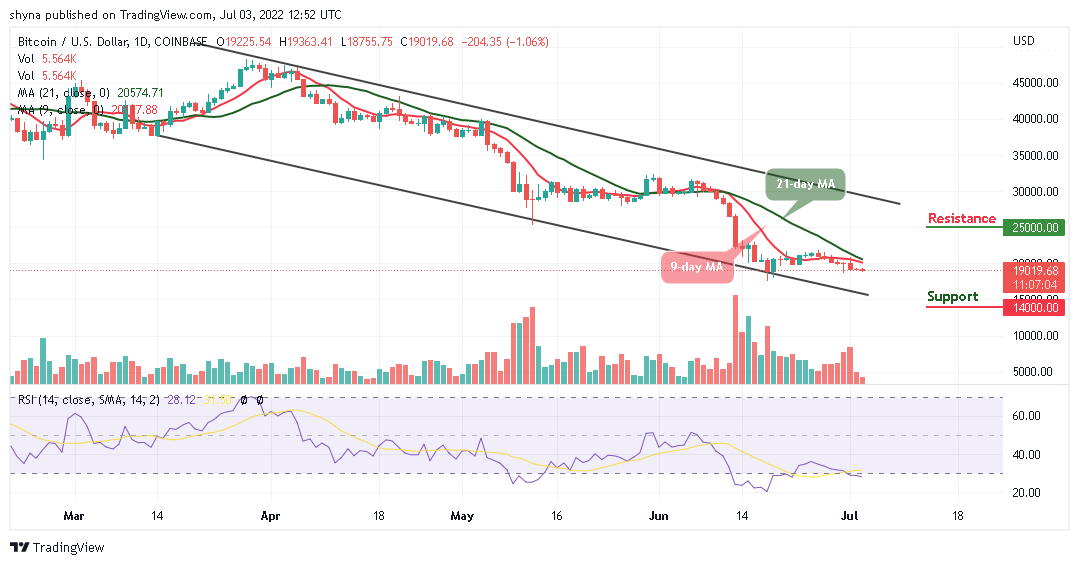
The Bitcoin price prediction shows that BTC may keep hovering below the moving averages as the coin touches $18,755 support.
Bitcoin Prediction Statistics Data:
- Bitcoin price now – $19,019
- Bitcoin market cap – $362.5 billion
- Bitcoin circulating supply – 19.0 million
- Bitcoin total supply – 19.0 million
- Bitcoin Coinmarketcap ranking – #1
BTC/USD Long-term Trend: Bearish (Daily Chart)
Key levels:
Resistance Levels: $25,000, $27,000 $29,000
Support Levels: $14,000, $12,000, $10,000
BTC/USD may face a setback that could drag the coin below the lower boundary of the channel, and the king coin is likely to have an additional bearish run. Currently, Bitcoin (BTC) is trading around the $19,019 level.
Bitcoin Price Prediction: Bitcoin (BTC) Remains in the Negative Zone
The Bitcoin price is currently nose-diving below the 9-day and 21-day moving averages touching the daily low at $18,755. If the price should slump below the support level of $18,000, it is likely to face more downward trends. Moreover, the further bearish movement could locate the supports at $14,000, $12,000, and $10,000, making room for BTC to fall even further.
However, the technical indicator Relative Strength Index (14) resumes back into the oversold region as the trading volume is in support of the bears. On the contrary, if bulls push the price back above the 9-day and 21-day moving averages, BTC/USD may move towards the upper boundary of the channel to locate the resistance levels at $25,000, $27,000, and $29,000.
BTC/USD Medium-Term Trend: Ranging (4H Chart)
On the 4-Hour chart, the Bitcoin price remains below the 9-day and 21-day moving averages, and the immediate support is likely to come at around the $18,500 level. The price may likely fall below this level if the bears continue to dominate the market.
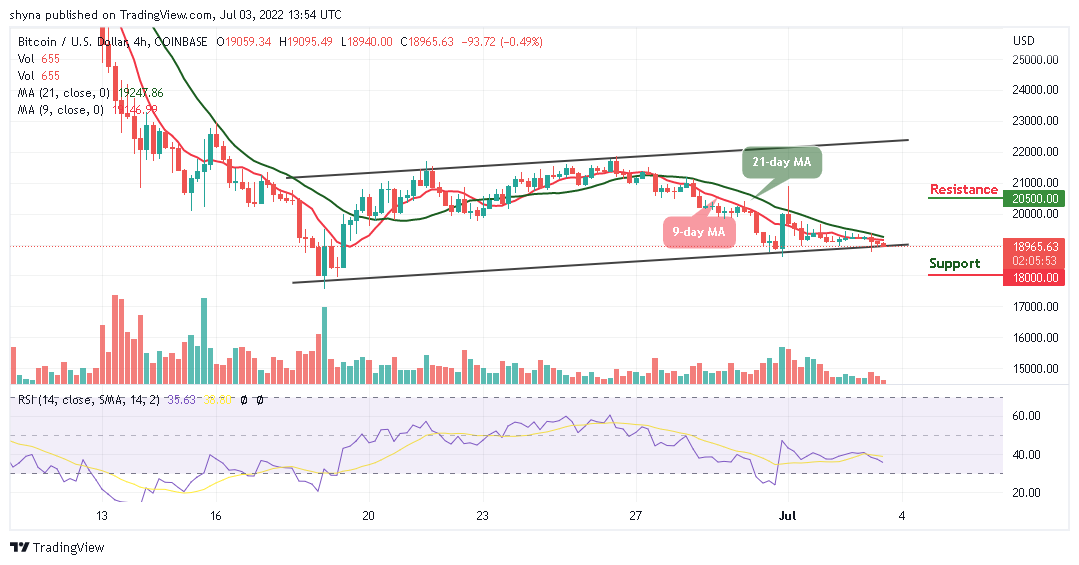
However, a further bearish movement could hit the critical support at the $18,000 level and below, while the resistance is located above the moving averages at the resistance level of $20,500 and above. Meanwhile, the Bitcoin price is currently moving on the negative side as the technical indicator Relative Strength Index (14) remains below 40-level.
Read more:
Join Our Telegram channel to stay up to date on breaking news coverage